
The post $182M Liquidated as Bitcoin Battles $61K—What’s Next for BTC? appeared first on Coinpedia Fintech News
Bitcoin failed to break the $66,000 resistance even though the double bottom pattern was completed. This shows how much bearish sentiment is filled in the market even when we are in the most bullish month for btc. The largest crypto remains in the downward parallel channel and it looks like getting trapped in an enclosed area. Let’s analyze the market and explore what is happening.
Failure of Double Bottom
A double bottom is a bullish pattern and represents a trend reversal. Bitcoin has been moving in a downward parallel channel since March and it looked like this was the bottom of this trend. However, since btc has received rejection from the $66,000 zone on September 29, the largest cryptocurrency is in a fall. Though it is making another double bottom with $60,000 as a base, it does not look like this is going to be executed. The market sentiment is bearish and was recorded at 39 points today. BTC has taken support from $60,600 in the previous hour and is trying to rise once again.
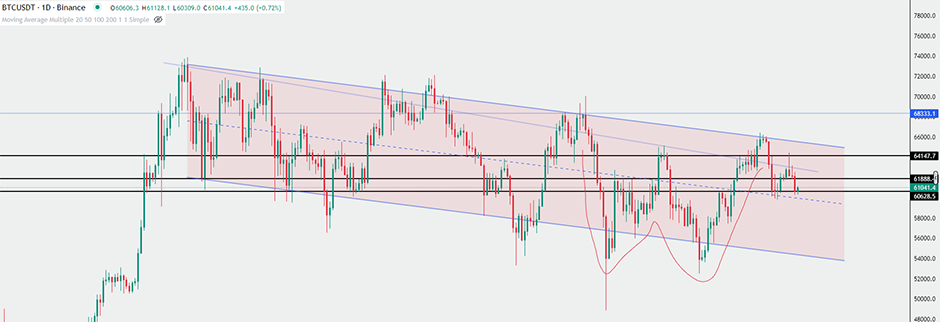
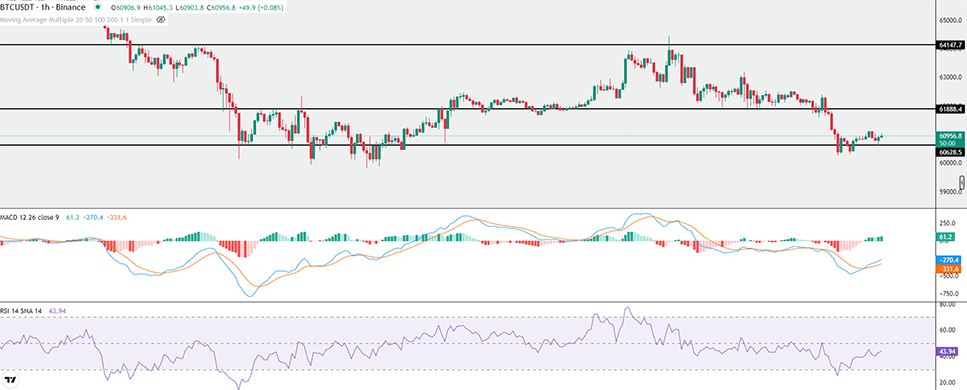
Bitcoin is currently trading at $60,975 and the nearest resistance it is facing lies just above this point. Moving average 20 is acting as the latest resistance in the hourly chart. If we switch to the four hourly chart we can see moving average 200 is resisting its path to rise.
Other Market Metrics
The long/short ratio of bitcoin supports the bearish sentiment of the market. The ratio is recorded at 0.98% which means traders are inclined towards taking more short trades as compared to longs.
MACD and RSI are signaling new buyers entering the market. MACD histogram is filling up with green showing new momentum in the market. This is supported by the rise of RSI which is not at 44.32
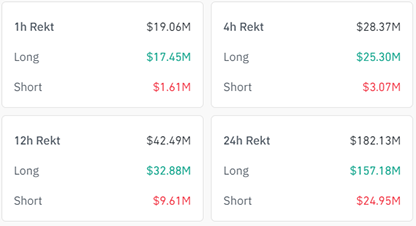
In the last 24 hours, 65,095 traders have been liquidated by the market. Over $182 million in trades vanished from the market. Data from the liquidity chart shows that there is a possibility of price moving up due to the presence of liquidity. In the next few hours we might see bitcoin price taking a spike.
Looking Ahead!
The market seems to be stuck in a confusion zone. However, the market metrics are suggesting an incoming rise. It would be difficult for bitcoin to move past the moving averages as they are also supported by various resistance zones. The next few hours are just to watch and analyze the movement of the market before making any decision.

 1 month ago
17





 English (US) ·