The post Avalanche(AVAX) & Polygon (MATIC) Prices, both Plunge Close to 8%, When Will Bulls Reclaim Their Position? appeared first on Coinpedia - Fintech & Cryptocurreny News Media| Crypto Guide
The Markets once again turn bearish after the prices face a slight upwards swing. Cryptocurrency price analysis indicates that the current phase is just a catapult action to rise the price beyond the intended targets very soon. Avalanche(AVAX) & Polygon(MATIC) prices after an equal price drain since the early trading hours are now trading within their respective channel.
Avalanche (AVAX) Price Analysis
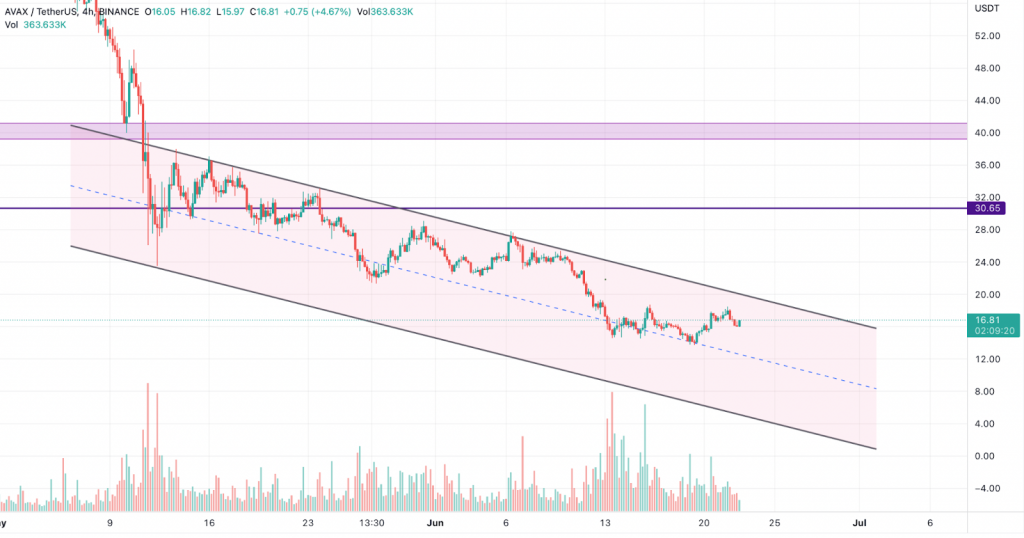
The AVAX price ever since the May beak-down appears to have stuck up in a huge bearish well. As the prices continue to maintain a steep descending trend, the possibilities of a strong rebound are also fewer. However, minor flips and rejections may continue until the asset experiences a strong influx of liquidity which could uplift the price beyond the immediate resistance levels.

The asset is constantly being forming lower highs and lows within a descending bearish channel. Interestingly, the price has maintained within the upper bands and refuses to drop below the average levels. Hence, increasing the possibility of maintaining the levels above $15. However, the price may slowly yet steadily maintain a significant upward swing and reach $18 before the day’s close. Further to this achieving $20 may not be a tedious job before the weekend.
Polygon (MATIC) Price Analysis
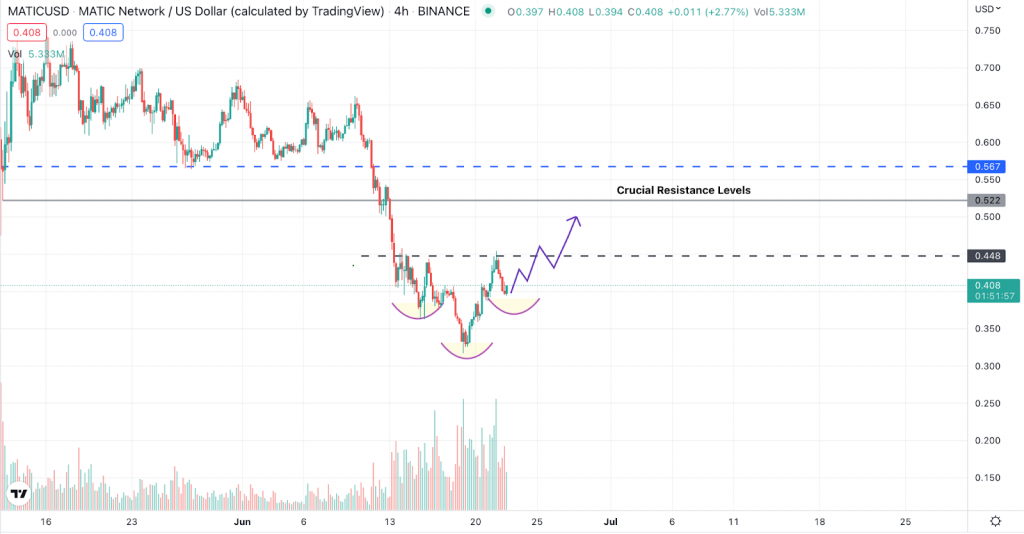
Polygon price on the contrary is flashing significant bullish signals, despite being rejected from one of the important levels. The pattern formed is extremely bullish which can give a larger boost to the asset as the buyers are also expected to enter the ring very soon. Moreover, the possibility of the asset smashing the levels, it slipped in May, amid the crash also surfaces.

As per the above chart formation, the MATIC price is trending within an inverse ‘head & shoulder’ pattern, which is said to be extremely bullish. The completion of the pattern may bring back the asset along the neckline which is supposed to be the deciding level. Usually, a breakout from this pattern results in testing the immediate resistance, which is above $0.52 in the present scenario.
These levels are very important and are required to hold firmly to maintain a significant upward swing ahead. Else the asset may continue hovering within the crucial ranges.

 3 years ago
141
![Story [IP] gains over 10% amid liquidity surge, but is a reversal here?](https://ambcrypto.com/wp-content/uploads/2025/07/Abdul-1.webp)


 English (US) ·