
The post Bitcoin Breached $65,000 ; Would it Hold or Fall Back to $63,000? appeared first on Coinpedia Fintech News
Bitcoin finally reached $65,000 after a long wait however, it does not look like BTC can sustain at this point. Since September 7 after bitcoin reached $53,900, it has been in a continuous rising mode and finally in two attempts breached the resistance at $65k. Let us explore the reasons why we believe bitcoin can retrace back to $64000 or even lower to $63,200.
Chart Analysis
At the time of writing, Bitcoin is trading at $65,660 which is above the resistance zone of $65,520. The four hourly chart shows that before finally breaching this section bitcoin had multiple failed attempts. Usually in such a case Bitcoin fails to cross and falls back to reclaim a support zone. This happens because the buyers get exhausted which gives a clean chance to the sellers to drag down the market. However in this case, it looks like more buyers were present during this time and that helped the crypto to rise.
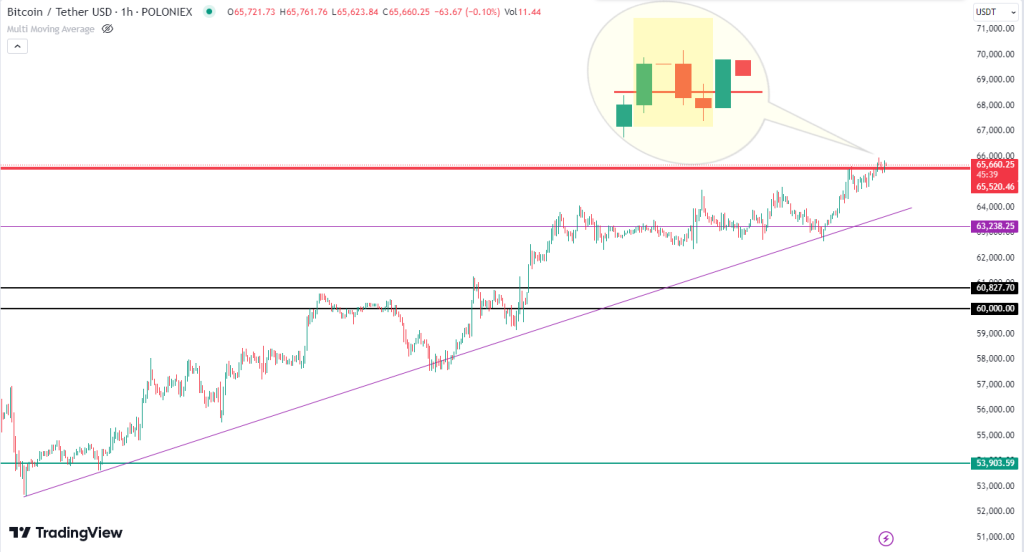
In this case, the possibility of Bitcoin claiming a support above $65,500 looks thin as RSI is about at the border of overbuying. RSI stands at 70 points and this can cause BTC to come down. Before retracing its steps, there are chances of bitcoin touching $67,000 but might fail to claim a support. On the other hand, if bulls want the market to open in a positive area, they must close the price above the sixty five thousand dollar zone.
The Negative Chart Pattern
On an hourly chart, if we see the current tip of this chart (marked on picture above), we can see the formation of a shooting start. This is a bearish pattern and is powerful when it appears at the top of a trend. If we take September 7 as the bottom of this trend, the current zone can be considered as the top. The appearance of the shooting star candle pattern along with the negative confirmation candle gives out the vibe of bitcoin rejection from this zone. There is a chance that bitcoin nullifies this pattern if the buying power stays strong.
Market Psychology
As today is the last day before the weekend, it is very crucial for the buyers to close the daily candle above $65,000. The bearish month of September is going to close on a Monday and the market should not enter a bullish month with a negative sentiment. Everybody is expecting the bull run to continue and for that Bitcoin must move to create an All Time High.
Liquidation Data
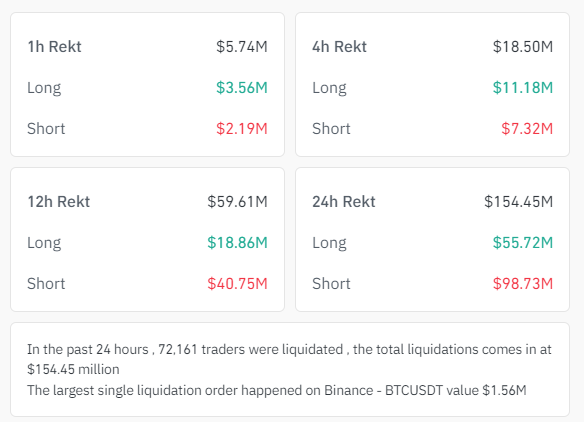
In the last 24 hours, over 72,000 traders have been liquidated. The most crucial time frame is the last 12 hours. During this period maximum short traders were liquidated as bitcoin kept rising with slight corrections. In the last 4 hours, a total of $26.71 millions worth of traders were liquidated. As the market keeps on rising, traders with shorts open will keep getting liquidation in the absence of stop-loss.
What to Expect?
Long traders and investors are no doubt expecting the market to keep rising however that is not possible in any scenario. Traders must keep in mind that they are against the market and hence getting over confidence in such critical areas might cost them their funds. In case Bitcon fails to register the support above $65,500 there are chances it comes down to 64,000. This zone can provide support from the trendline as well as from moving average 20. Also the presence of shooting star patterns might give some trouble. If the buying powers keep coming bitcoin only has to justify one support on 4 hourly chart and confirm it. It would be very interesting to see if bulls would be able to hold the price above $63,000 or will it fall back to $64,000.

 2 months ago
16



 English (US) ·