 22 hours ago
11
22 hours ago
11

With macro concerns easing, Bitcoin bulls made an attempt to breach the $110,000 mark before pulling back.
The total cryptocurrency market capitalisation, which had fallen to a weekly low of $3.36 trillion, rebounded to $3.48 trillion later in the week, driven by bullish developments out of the US.
This late-week optimism pushed market sentiment higher, with the Crypto Fear & Greed Index rising to 73, firmly within the Greed zone.
Altcoins followed a similar upswing late in the week, but much of those gains were wiped out by Friday as Bitcoin once again failed to hold above $110,000, marking its third rejection at that level this month.
Weekly momentum was largely driven by meme coins, which dominated the top 100 rankings during late Asian trading hours on July 4, capturing the spotlight with outsized gains amid broader market volatility.
Why did Bitcoin go up?
After some early‑week volatility, Bitcoin surged to a weekly high of $110,386 on Thursday, ignited primarily by the announcement of a landmark US–Vietnam trade agreement.
Under the deal, Vietnam agreed to slash tariffs on US goods, with US tariffs dropping from previous levels of 46% to just 20%, with zero duties on imports entering Vietnam, significantly easing trade tensions and bolstering risk appetite across global markets.
This diplomatic win, combined with a cooling of US export restrictions on semiconductors to China, propelled a meaningful risk-on shift, lifting equities and derivatives markets and cascading positive sentiment into crypto.
Further, June’s non-farm payrolls data exceeded expectations with 147,000 jobs added, well above the projected 110,000, while the unemployment rate fell to 4.1%.
Bitcoin extended its rally as traders priced in stronger consumer demand and near-term resilience, with flows into spot ETFs accelerating alongside a broader surge in risk markets.
However, the fervor was short‑lived. As markets reassessed the data through the lens of Federal Reserve policy, traders scaled back expectations for a July rate cut, FedFunds futures showed a sharp rise in odds for no easing until at least September.
That recalibration triggered a swift pullback, with Bitcoin dipping just under $109,000 as liquidity quickly shifted from crypto back to safer havens.
What’s next for Bitcoin?
Bitcoin bulls were thwarted in an attempt to regain support at $110,000 on Thursday as US employment data exceeded expectations, dealing a blow to hopes of interest-rate cuts before September.
This is the third failed attempt since the May all-time high, casting doubt on Bitcoin’s ability to breach $110,000 and enter price discovery again.
Historically, multiple rejections near all-time highs have preceded sharp drops in BTC price.
For example, Bitcoin price was rejected multiple times from the $107,000 level in January, just 2% below the previous all-time high of $109,000 reached on Jan 20. This preceded a 14% price drop over the two weeks that followed.
If history repeats, some analysts are worried the BTC/USD pair might drop 14%-18% from current price levels.
Additionally, high-taker sell volume around $110,000 and neutral funding rates in futures markets point to profit-taking and hesitation among traders, increasing the likelihood of a pullback.
Such trends are common when prices hover near all-time highs, often prompting long-term holders to realise profits and exit positions.
Looking at the 24-hour liquidation heatmap for the Bitcoin BTC/USDT trading pair, it’s clear that there’s strong resistance around the $110,000 to $112,000 mark.
These areas have consistently rejected upward momentum, confirming that sellers are dominating at higher levels and limiting Bitcoin’s ability to enter price discovery.
 Binance BTC/USDT Liquidation Heatmap. Source: Coinglass.
On the downside, support appears to be forming near the $106,000 and $104,000 levels, with visible absorption and liquidations indicating renewed buyer interest.
If current selling pressure intensifies, a breakdown below these thresholds could open the door for a deeper correction toward $103,000, where the next liquidation cluster lies.
For now, Bitcoin could be moving rangebound between $103,000 and $110,000, unless market sentiment tilts decisively in either direction.
One potential trigger for short-term volatility could be selling pressure from “Satoshi era” Bitcoin holders.
Over the past week, a number of dormant whales re-emerged, most notably a coordinated move from eight wallets that had been inactive for over 14 years, collectively transferring out 80,009 BTC, worth an estimated $8.69 billion at the time of movement.
UPDATE: ALL 8 WALLETS WOKE UP AFTER 14 YEARS OF DORMANCY AND TRANSFERRED OUT 80,009 $BTC WORTH $8.69B.
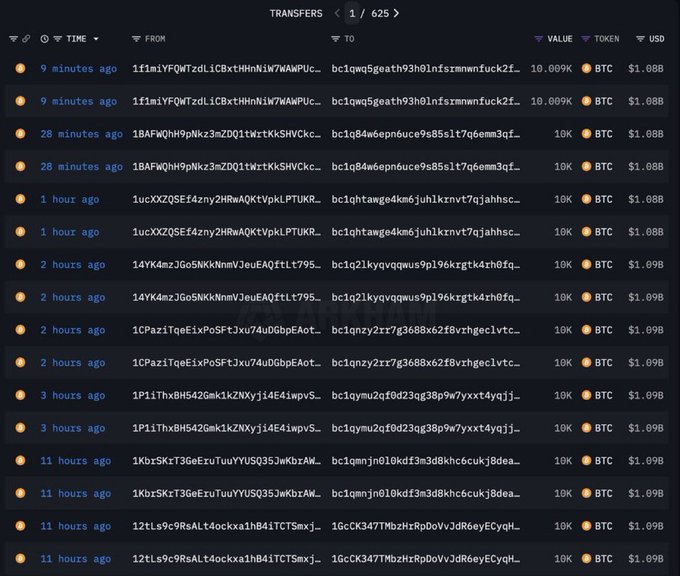
While the destination wallets remain unknown, such large-scale movements from early holders often signal internal rebalancing, custodial shifts, or potential liquidation, factors that tend to unsettle near-term market confidence when Bitcoin is already struggling to sustain new highs.
Nevertheless, some analysts believe bullish developments in the US could reinforce momentum for Bitcoin and see it hitting new highs in the coming days.
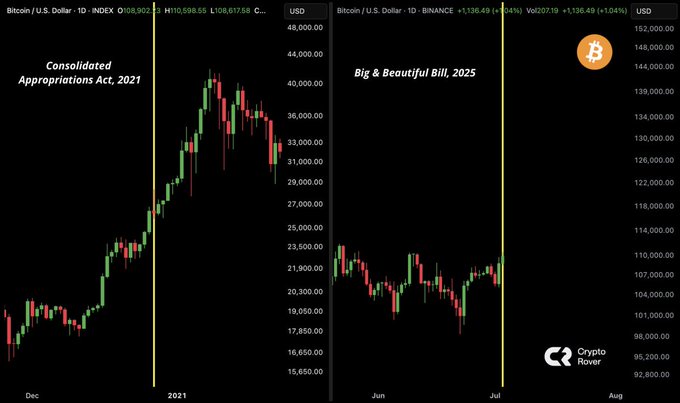
Much of that optimism centres on the potential impact of President Donald Trump’s so-called “Big Beautiful Bill,” a massive spending package expected to inject trillions into the US economy.
The bill, which is reportedly being finalised around Independence Day, has already sparked renewed interest in risk assets, including Bitcoin.
Historical precedents suggest this optimism may not be misplaced. When Trump signed a major COVID-19 relief bill in late 2020, Bitcoin jumped by 38% over the following weeks. If a similar reaction plays out again, a comparable rally would push BTC/USD well past $150,000.
THE LAST TIME TRUMP INTRODUCED A MASSIVE SPENDING BILL. BITCOIN PUMPED 38% IN JUST ONE WEEK. HE IS EXPECTED TO SIGN THE BIG, BEAUTIFUL BILL INTO LAW TOMORROW.👀
Markets are also factoring in the implications of mounting U.S. debt. Forecasts suggest the national debt could hit $40 trillion in 2025, nearly double the $23.2 trillion recorded at the start of 2020.
From a macroeconomic standpoint, such aggressive borrowing has traditionally acted as a tailwind for Bitcoin, which thrives in environments of fiat dilution and fiscal expansion.
If the “Big Beautiful Bill” becomes law, the flood of liquidity it unleashes may offset near-term resistance and profit-taking, setting the stage for Bitcoin to break out of its current range and resume its long-term uptrend.
When writing, Bitcoin was hovering over $107,500, up just 0.3% over the past 7 days.
Top Altcoin this week
The total market cap of all altcoins rose 8% to a weekly high of $1.35 trillion before settling at around $1.29 trillion as of press time.
Ethereum, the altcoin with the biggest market cap, was up 3.2% over the past 7 days, trading around $2,500 key support level. XRP (XRP), Solana (SOL), Tron (TRX), and Dogecoin (DOGE) held gains ranging between 2 and 7%.
The highest gains this week were pulled by Pudgy Penguins (PENGU), which rose 62.7% over the period. Bonk (BONK) and Fartcoin (FARTCOIN) followed with gains of 26.4% and 19.4% respectively.
 Source: CoinMarketCap
PENGU rallied for seven straight days following a surge in interest after the Cboe BZX Exchange proposed the listing of the Canary PENGU ETF with the US securities regulator.
Additionally, its listing on crypto exchange Biconomy.com and a surge in NFT sales over the past week also contributed to its price appreciation.
Bonk’s rally this week followed after the project’s team disclosed plans to burn 1 trillion BONK tokens from circulation once the number of holders hits 1 million, a milestone that is aimed at creating long-term scarcity.
According to data from CoinGecko Terminal, the current holder count stands at approximately 943,890. At this rate, the 1 million threshold is expected to be reached in the coming months.
While no particular development could be identified for FARTCOIN’s gains when writing, it was likely driven by a broader rally across the memecoin market sparked by Bitcoin’s recovery this week.
The post Bitcoin bulls struggle to breach $110k, memecoins PUDGY, BONK, FARTCOIN lead weekly chart appeared first on Invezz


 English (US) ·