 7 months ago
62
7 months ago
62

Bitcoin Cash (BCH) has completely recovered from its recent market dip after soaring by about 47% over the past three days.
BCH was trading at $392.8 at press time, marking a two-month high for the altcoin.
Following the remarkable recovery, analysts are buzzing with excitement, drawing parallels to its explosive rally in late 2017.
Back then, BCH’s price soared from $312 to $4,100 in just two months—a jaw-dropping 1,200% increase.
But could history be repeating itself?
A familiar pattern emerges
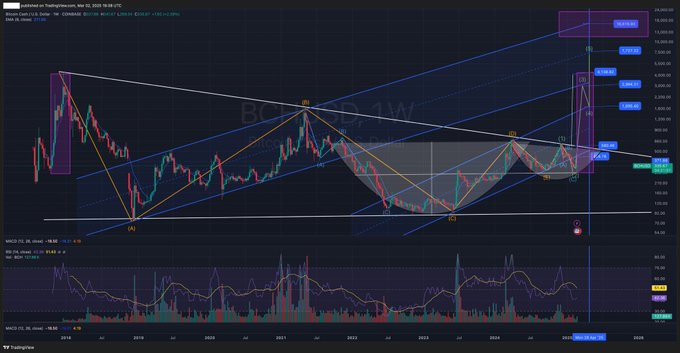
Crypto analyst “salx” on March 2, 2025, X pointed to a “cup and handle” pattern forming on BCH’s chart.
This bullish setup, he argues, mirrors the 2017 breakout that propelled BCH to $4,100.
Salx believes this move could unfold within 30 to 90 days, potentially pushing the price to that same lofty target by May 2025.
The recent 12.8% jump in 24 hours only fuels his optimism. If he’s right, BCH holders could see gains exceeding 900% from current levels.
$BCH Bitcoin Cash: October 9th 2017 – $312 December 18th 2017 – $4,100 Top to bottom cup and handle breakout: $4,100 We are about to repeat 2017 move in 30-90 days
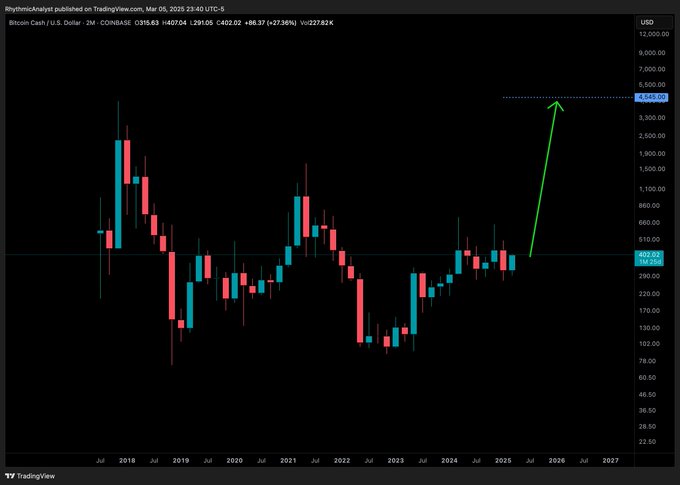
Affirming the bullish projections, another analyst, Mihir, posted on X, predicting BCH could hit $4,545—a potential 1,035% leap.
Though he offered no timeline, his target tops even Salx’s ambitious call.
BCH for 4545 USD. $BCH #BCH #BitcoinCash
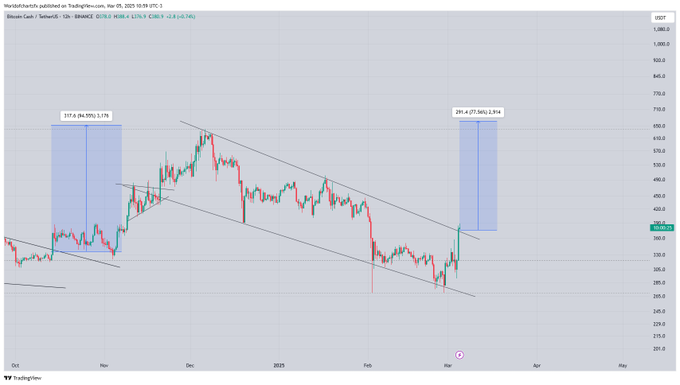
Meanwhile, World Of Charts sees a more modest 77.56% rise to $625 if BCH breaks key resistance.
Bitcoin Cash on-chain data backs the hype
Besides the price surge, the Bitcoin Cash blockchain itself is also telling a compelling story.
Data from Bitcoin Cash Explorer shows transactions at an all-time high.
 BCH transaction count by Bitcoin Cash Explorer
This surge signals growing trader interest and increased liquidity on the BCH network.
At the same time, futures open interest, according to Coinglass’ Bitcoin Cash (BCH) derivatives data analysis, climbed from $174.48 million on Sunday to $363.13 million on Thursday morning—the highest since early February.
Rising open interest means new money is flowing in, a classic sign of an impending rally.
Together, these metrics (the rising transaction count and the rising open interest) paint a picture of a coin gaining serious momentum.
Technical indicators support the bullish predictions
The charts also align with the bullish narrative. BCH recently retested a key support zone between $279.2 and $299.7, bouncing to close at $320.5 on Tuesday before exploding to a high of $420 on Binance.
The Relative Strength Index (RSI) on the daily chart reads 65.64, which is above the neutral 50 mark and trending up, hinting at strong momentum, although there is a pullback risk if it enters the overbought region.
A bullish crossover in the 9-day and 21-day Moving Averages and the Moving Average Convergence Divergence (MACD) adds to the case.
 Bitcoin Cash price chart by TradingView
Analysts believe holding the current trading range could spark a 14.37% rally toward the next resistance level at around $450, highlighted in the chart above.
With all the indicators pointing to a likely bull run, it remains to be seen if Bitcoin Cash (BCH) will repeat its 2017 glory or carve a new path in the coming weeks.
The post Bitcoin Cash hits two-month high as analysts predict a 2017-style rally appeared first on Invezz


 English (US) ·