
The post Bitcoin Crash Alert! BTC Price to Hit New Lows in November If This Scenario Plays Out appeared first on Coinpedia Fintech News
The bloodbath of the cryptocurrency market continues to flow due to the meltdown of crypto market capitalization and worst-than-expected inflation data despite the Federal Reserve’s efforts to minimize it.
Bitcoin investors are waiting for a new catalyst as the crypto king has been trading in a range-bound area since last week. However, according to the all-time price chart of Bitcoin, it now seems that Bitcoin may fall to 11K as it forms a similar pattern before crashing to $3.2K in 2018.
BTC Price To Plunge Below $11K Following 2018’s Pattern!
Looking at Bitcoin’s all-time price graph, BTC is forming a consolidation level at $19,500. This formation of BTC is similar to 2018’s price graph, as BTC built a range-bound zone near $11,400 before crashing to $3,200 during that year.
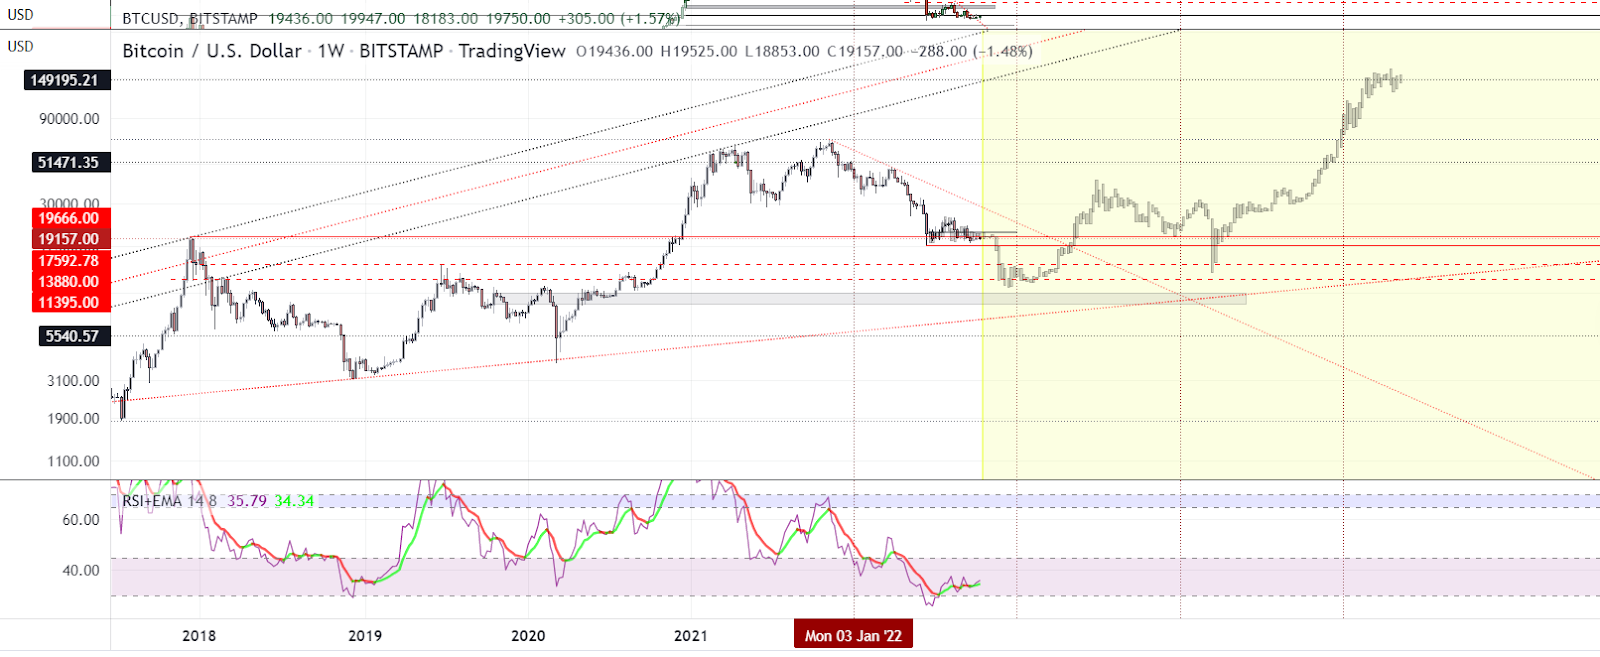
Therefore, it can be concluded that Bitcoin’s death dance is not yet over, as Bitcoin may fall to $11K following 2018’s graph formation. The graph further indicates that Bitcoin may start its bullish phase after reaching the bottom line by the end of next month. Bitcoin may be projected to touch a high of $40.4K by the end of the first half of 2023.
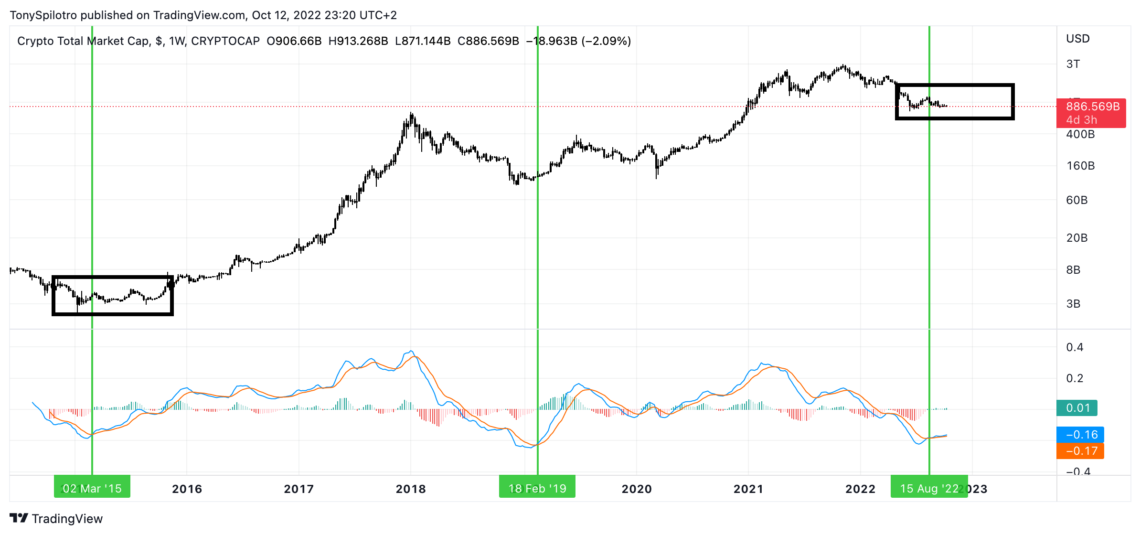
The crypto market capitalization is also following 2015’s bear market, as LMACD made the same breakouts in 2015 and 2019 before initiating an upward trend. If the same applies to the current crypto winter, investors can definitely witness a bullish phase of the crypto market in 2023.
CPI Data Becomes A Catalyst For Bitcoin’s Volatility
The world has been moved due to an exponential inflation rise, and so has the cryptocurrency market. The latest CPI data has left a profound impact on cryptocurrency prices as the inflation data touched highs in the last four decades. To dominate the inflation rate, the FED implemented additional interest rates to which the crypto’s market reaction is not mesmerizing.
According to CoinMarketCap, BTC is currently trading at $19,700 with an uptrend of nearly 4%. It is to be mentioned that investors used the CPI data to manipulate Bitcoin price, as Bitcoin made a low of $18,190 yesterday. Bitcoin gained nearly $2K in just a day, which indicates a deep price manipulation.
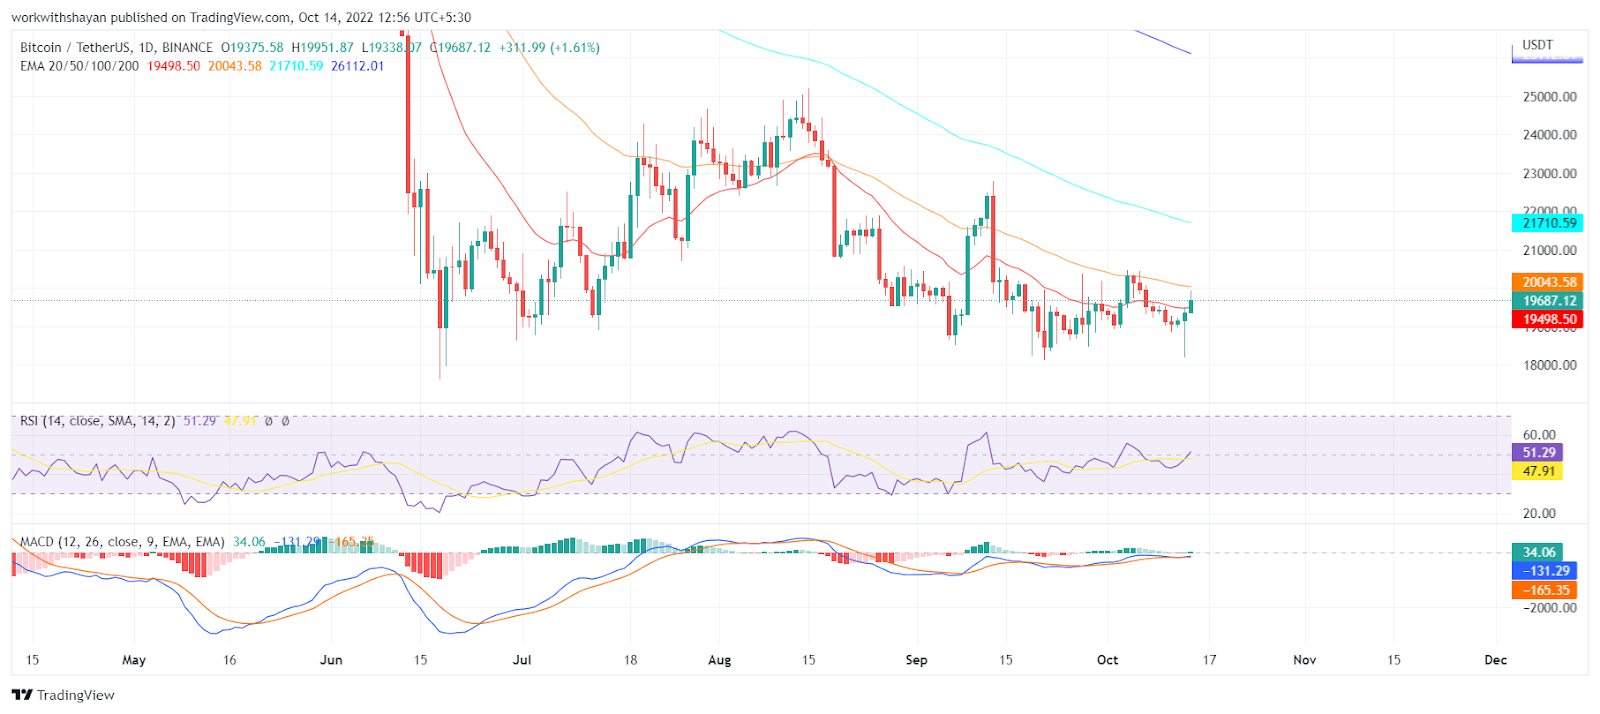
However, Bitcoin price is now again moving towards its primary resistance level of $20K, and if it holds above this level, we can see an upward move to the next immediate resistance level of $22K, where the EMA-100 is currently trading. EMA-20 and EMA-50 are presently in an upward motion, and EMA-50 is trading near the $20K level, hinting at a short-term recovery.
Conversely, the Bollinger band’s lower limit still remains at $18K, and below this level, Bitcoin price may plunge to its critical support level of $17,500. The RSI-14 is trading below the 50-level, which indicates that the current positive momentum of Bitcoin is short-term as BTC price may soon follow its previous trends and end up this year with bearish woes.


 English (US) ·