The post Bitcoin Crash: Will BTC Price Hit $52k Within a Bear Channel? appeared first on Coinpedia Fintech News
With the recent crash under $61,000, the BTC price warns of a bearish continuation in the coming weeks. The growing bearishness in the crypto market warns of a canceled Uptober rally this year.
With the crucial support of $60,000 at risk, will Bitcoin find a reversal spot before $50,000 in case of a breakdown? Will this crash in BTC price reach $50,000? Let’s find out in our Bitcoin price analysis.
Bitcoin Price Performance
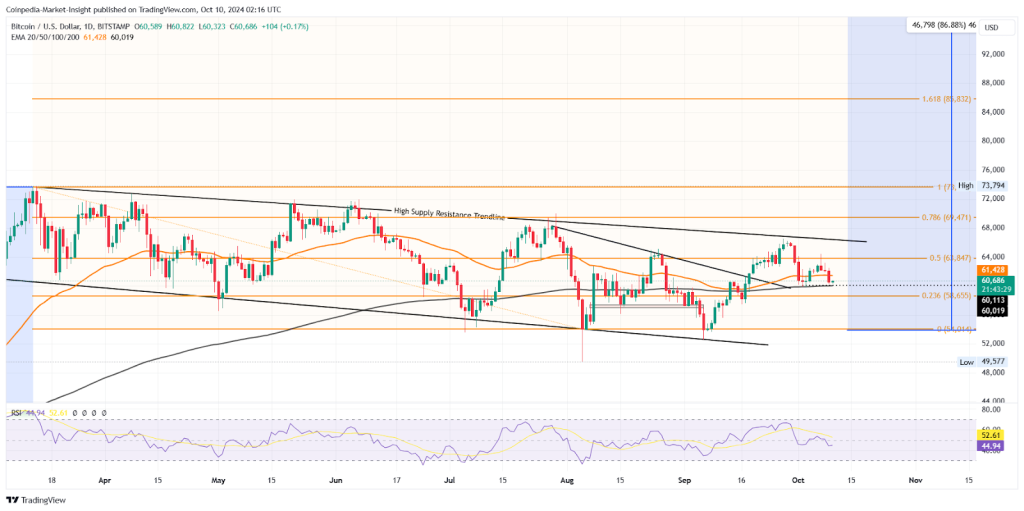
Amid the failed recovery chances, the short-term rejection in BTC price near the $64k level leads to another bear cycle. The reversal phase puts additional pressure on the $60,000 support with the 2% fall yesterday.
Currently, the BTC price is trading at $60,686 with a minor intraday gain of 0.17%. The downfall creates a lower high formation and warns of an extended bear cycle within the bearish channel.

Supporting the technical analysis, Martinez Ali, in a recent X post highlighted the Bitcoin price trend trapped in a descending channel. Based on his analysis, the middle boundary at $58,000 and the lower boundary at $52,000 are critical support levels. On the upside, a bullish breakout will require the BTC price to clear the $66,000 mark.
On-Chain Reveals Critical Support at $58,943
Based on the In/out of the Money around the price, buyers with an average price between $51k and $69k, 35.58% volume is “In the Money”.

Further, the indicator highlights the next critical support zone extending from $58,943 to $60,755. Within this range, 1.56M addresses have bought 679.42k Bitcoin. Currently, the overhead resistance zone ranges from $60,828 to $62,640.
Will BTC Price Sustain Above $60k?
With the short-term surge in supply pressure, the $60k support is under pressure. However, the 200D EMA acting as a dynamic support adds strength.
Successively, a breakdown will test $58k and $55k to provide the next reversal spot. Conversely, a bullish turnaround will test the $64k and $66k resistances.
Curious about Bitcoin’s bull run in October? Check out Coinpedia’s Bitcoin (BTC) Price Prediction for an overview of long-term targets!

 1 month ago
16


 English (US) ·