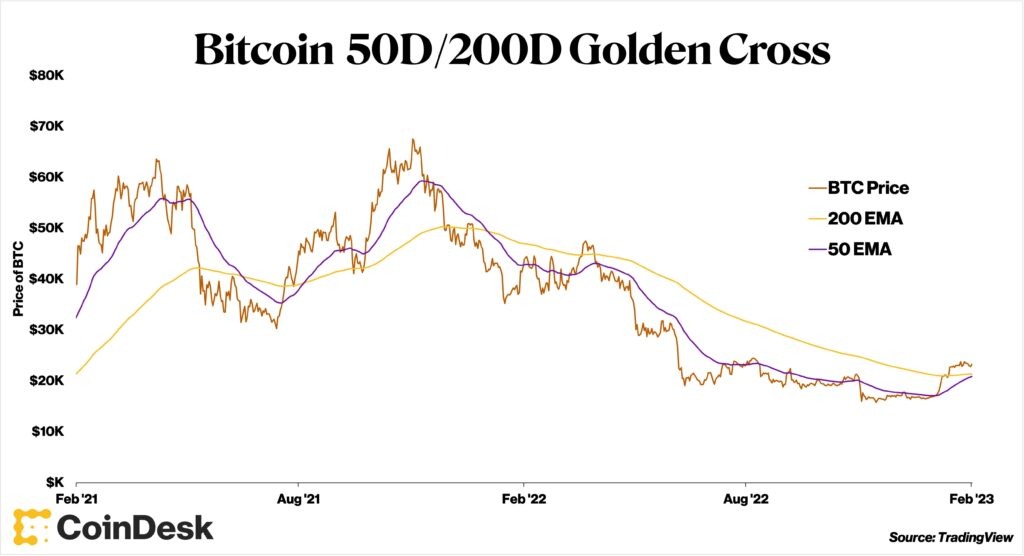
Bitcoin (BTC) made a rare “golden cross” on Feb. 18, a bullish signal that generally portends short-term upside.
A golden cross represents an asset’s 50-day moving average above its 200-day moving average. Since 2015, Bitcoin has experienced only six golden crosses. Last time was August 14, 2021.
The indicator uses Bitcoin’s Exponential Moving Average (EMA), not Simple Moving Average (SMA). The EMA gives weight to more recent price data as opposed to the SMA measuring each date equally. Which one to use is a matter of personal preference, and in SMA, the golden cross happened on February 7th.
 Bitcoin price (brown), 200-day EMA (yellow), 50-day EMA (purple)
/ TradingView
Post-Golden Cross performance has been strong in the past, with 7-day and 30-day average returns of 3.8% and 8.3%, respectively. This is above the 1.6% and 7.5% figures for the entire period, indicating that buying Bitcoin after the golden cross will lead to good returns. There have been six other SMA crossovers since 2015, with 7-day and 30-day average returns of 2.7% and 10.6%, respectively.
A rally to its historical average would see Bitcoin break above $26,500 starting at the close on February 18. Currently, Bitcoin is struggling to maintain the psychologically important levels of $25,000.
Over the last four days, Bitcoin has cycled between positive and negative, with no clear direction in sentiment at this point.
|Translation: coindesk JAPAN
|Editing: Takayuki Masuda
|Image: TradingView
|Original: Crypto Markets Analysis: Bitcoin Breaches Rare ‘Golden Cross’ Threshold
The post Bitcoin, Golden Cross ── No clear direction seen | coindesk JAPAN | Coindesk Japan appeared first on Our Bitcoin News.

 2 years ago
124


 English (US) ·