 6 hours ago
12
6 hours ago
12

Bitcoin extended its bull run on Monday, briefly hitting a new all-time high before losing momentum as bearish macro developments emerged.
For the first time since December, the total crypto market cap broke back above $3.8 trillion, hitting an intraday high of $3.89 trillion before receding.
Throughout the day, investors maintained a strong risk-on stance, with the Fear & Greed Index anchored at 74 and flashing “Greed.”
Much of the day’s liquidity chased Bitcoin’s breakout, leaving altcoins trailing with only modest gains, which had mostly faded after the tariff tensions emerged.
Why is Bitcoin going up?
Bitcoin surged above $123,000 for the first time ever, hitting a new all-time high of $123,091.61 earlier in the day.
A number of bullish catalysts are currently driving Bitcoin’s rally.
This week, the focus has shifted to Capitol Hill, where US lawmakers are set to consider three pivotal crypto-related bills.
A key bullish catalyst is driving the current rally.
The GENIUS Act, a bipartisan measure aimed at establishing stablecoin oversight, has already cleared the Senate and is widely expected to pass in the House.
If signed into law, it would mark one of the first major regulatory frameworks for stablecoins and confirm political willingness to integrate digital assets into the broader financial system.
The CLARITY Act is also on the table. It seeks to define jurisdictional boundaries between the Securities and Exchange Commission (SEC) and the Commodity Futures Trading Commission (CFTC), which could offer long-awaited legal clarity for crypto projects.
In parallel, a separate bill aiming to prohibit the Federal Reserve from issuing a central bank digital currency is under consideration, reinforcing pro-crypto sentiment among investors who view CBDCs as potential threats to decentralised finance.
Bulls are also leaning on optimism around a potential policy shift from the Federal Reserve and improving macroeconomic conditions.
While no rate cuts have been confirmed, all eyes are on this week’s US inflation data.
A softer-than-expected report would strengthen the case for the Federal Reserve to cut rates as early as July, a scenario already priced in by many traders.
Goldman Sachs and Morgan Stanley now expect at least two cuts this year, followed by multiple reductions in 2026.
Historically, Bitcoin has shown strength during rate-cutting cycles as investors rotate into risk assets.
Lastly, Institutional flows into crypto ETFs are also playing a key role in driving prices higher.
Spot Bitcoin ETFs recorded over $2.72 billion in net inflows last week, a surge of roughly 250% from $769 million recorded the week before.
With total inflows surpassing $52 billion, these ETFs have become a clear barometer of institutional appetite for digital assets.
What’s next for Bitcoin?
Looking at commentary on X, most market analysts seemed convinced that Bitcoin’s current rally is far from over. See below.
However, the momentum seems to have lost some steam with the US threatening fresh tariffs on Russia unless the Ukraine conflict is resolved within the next 50 days.
The warning sparked caution across global markets, triggering a brief risk-off pullback that saw
Bitcoin dropped over 2% from its intraday high.
When writing, the asset was trading just above $120,000, with traders trimming positions amid renewed geopolitical uncertainty.
While the broader macro backdrop remains supportive, the tariff threat adds a layer of volatility in the short term.
Market participants will be closely watching for further developments out of Washington, as any escalation could pressure risk assets further, even as rate cut expectations and ETF inflows continue to underpin longer-term bullish sentiment.
Looking at the 24-hour Binance BTC/USDT Liquidation Heatmap, bears were already eating into stacked long positions clustered between the $121,000 and $120,000 range, triggering a cascade of liquidations as the price broke below key intraday levels.
 Binance BTC/USDT Liquidation Heatmap. Source: Coinglass.
On the downside, liquidity remains dense between $117,000 and $118,000, marking a critical support area where aggressive buying interest could emerge if the correction deepens.
If Bitcoin breaks below this zone, the next cluster of liquidations appears near $115,500, which could act as a final line of defence before the trend structure is meaningfully challenged.
Upside pressure, meanwhile, faces stiff resistance around $122,000 and again near $123,500, where multiple short liquidations are positioned.
A clean move above these thresholds could reignite bullish momentum and potentially open the door for a rally towards $130,000.
From here, Bitcoin’s next move will likely hinge on macro cues and whether dip-buyers can defend the $117,000–$118,000 range.
A rebound off that zone, paired with easing geopolitical tensions, could set the stage for a sharp recovery and another test of record highs.
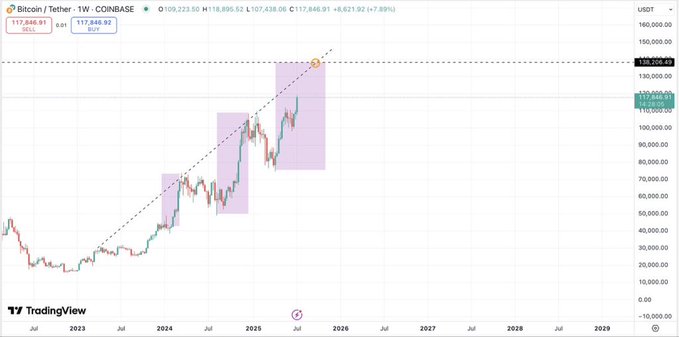
When looking at the long-term picture, analysts are pointing to structural similarities with previous breakout phases, particularly the early 2024 rally that preceded a 50% move.
 BTC/USDT weekly chart. Source: Edward on X.
According to pseudonymous market commentator Edward, the current setup mirrors that earlier breakout, with $135,000 to $140,000 no longer viewed as speculative, but simply one clean breakout away.
However, the flagged a key cluster of interest around $115,500 to $116,500, a zone that could serve as a structurally sound retest if the $120,000 level fails to hold.
“If $BTC fails to hold above $120K, a dip to $114K–115K would be structurally clean. That doesn’t mean the uptrend breaks. It’s part of the expansion–contraction rhythm in every strong leg,” Edward said.
Altcoin market recedes
The altcoin market cap fell by 11% to $1.44 trillion over the past 24 hours, as $779.74 million worth of assets were liquidated across the total crypto market, as renewed macroeconomic concerns weighed on investor sentiment.
Investors showed a mixed sentiment towards the top 100 altcoins by market cap.
While Ethereum (ETH), Solana (SOL), and XRP (XRP) held onto minute gains of 1%, 1.2% and 5.3% respectively, Tron (TRX), Cardano (ADA), and Hyperliquid (HYPE) saw losses between 1-2%.
Sui (SUI) led the highest gains among them, holding up 11.9% over the day, while XDC Network (XDC) and Uniswap (UNI) were up 9% and 7.6% respectively.
 Source: CoinMarketCap
Sui: SUI’s rally may have been driven by its DeFi total value locked (TVL) hitting a new all-time high of $2.20 billion.
A rise in TVL usually points to growing activity on the network, which often supports price growth.
XDC Network: No particular catalyst was identified at press time, though XDC may still be riding residual momentum from 21Shares’ launch of a dedicated exchange-traded product earlier this month.
The ETP, listed under the ticker XDCN on Euronext Paris and Amsterdam, offers institutional investors direct exposure to the XDC Network.
Uniswap: Whale accumulation is driving Uniswap’s gains today, supported by data from Nansen, which shows that these large holders currently hold 5.25 million UNI tokens, up 56% over the last 30 days. Such a surge in whale activity often boosts market confidence in the related asset, prompting retail investors to follow suit.
The post Bitcoin rally disrupted by US–Russia tariff fears as top altcoins erase daily gains appeared first on Invezz


 English (US) ·