 1 month ago
48
1 month ago
48

Bitcoin bulls failed to break above $106,000 earlier today and have since retested $104,000, which now appears to be acting as a new support zone amid a broader market downturn.
The broader crypto market slipped over 3% in the past 24 hours, pulling total capitalisation down to $3.38 trillion.
Still, sentiment stayed upbeat, the Crypto Fear and Greed Index held firm at 74, keeping the market deep in Greed territory.
Gains across altcoins were barely noticeable, hovering between 0.5% and 1.0%.
Why is Bitcoin down today?
Bitcoin’s drop appears tied to renewed risk-off sentiment across global markets.
After hovering near $106,000 over the weekend, the leading cryptocurrency slid to an intraday low of $102,870 on Monday, tracking weakness in U.S. equity futures and broader investor caution.
The selloff wasn’t isolated to crypto. Futures tied to the Nasdaq 100, Russell 2000, and S&P 500 each fell more than 1% during Monday’s early session, while Dow Jones futures slipped by 0.70%.
At the core of Monday’s market downturn was Moody’s decision to revise its outlook on the US credit rating from stable to negative, citing a worsening fiscal trajectory.
Moody’s is one of the world’s three major credit rating agencies, alongside S&P Global Ratings and Fitch Ratings. It provides credit ratings, research, and risk analysis for governments, corporations, and financial instruments.
Moody’s is the last of the three major credit rating agencies to maintain a top rating for the US, and a negative outlook signals a higher risk of a future downgrade.
The agency pointed to rising debt levels and political gridlock as key threats to the country’s long-term creditworthiness.
Historically, credit rating downgrades have rattled markets.
A similar slump followed Fitch’s downgrade of US debt on August 1, 2023, while an even earlier downgrade by S&P Global in 2011 also triggered heavy selloffs across risk assets.
Investors were quick to react to the warning, with concerns deepening over America’s ballooning debt.
According to the US Debt Clock, the national debt now exceeds $36.8 trillion, up from $21 trillion just five years ago.
Those fears were further stoked by the House’s recent agreement on the so-called “Big, Beautiful Bill,” a sweeping legislative package that includes tax cuts estimated to cost up to $5 trillion over the next decade, partially offset by $1.5 to $2 trillion in projected spending cuts.
Adding to the market’s unease, the Federal Reserve has signaled a cautious approach to monetary policy.
Despite calls, Fed officials have indicated that interest rates will remain unchanged in the near term, citing ongoing economic uncertainty and the need for more definitive signals about the economy’s trajectory before considering any rate cuts.
What’s next for Bitcoin?
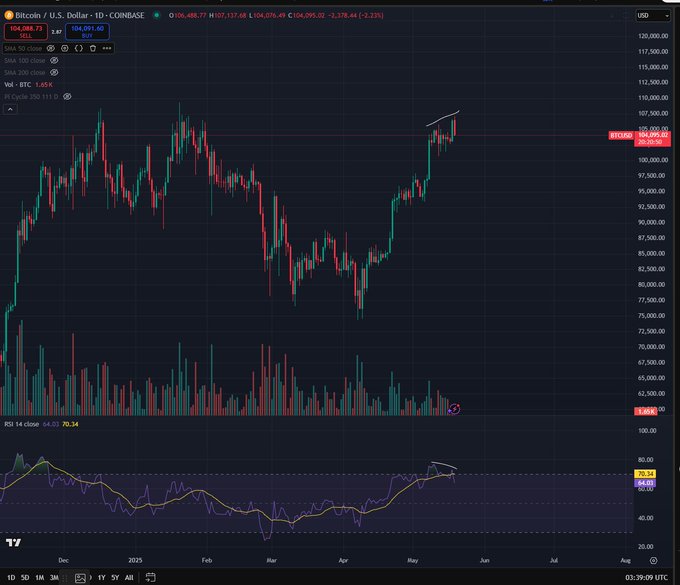
On the technical front, Bitcoin was already flashing signs of weakness ahead of Monday’s drop.
While Bitcoin climbed to a new local high above $107,000 on May 19, analysts noted a bearish divergence as the relative strength index (RSI) printed a lower high.
there’s a daily $btc bear div brewing here if it closes red by tomorrow. its unfortunate that its appeared before fresh ath’s but its the first one since last year. be careful with longs imo
That classic bearish divergence between price and momentum often hints at a trend reversal, and this time, it delivered.
BTC quickly tumbled 4.5% intraday, and trader Bluntz wasn’t surprised, warning followers to “be careful with [placing] longs.”
Adding to the caution, analysts at Swissblock pointed out that Bitcoin had simply “grabbed liquidity” above the $104,000–$106,000 resistance zone without actually securing a proper breakout.
That move was followed by a sharp rejection, pulling the price right back into a previously contested range.
Bitcoin now finds itself hovering just above immediate support between $101,500 and $102,500, a zone that’s currently being tested.
If this support zone gives way, Swissblock sees the $97,000 to $98,500 range as the next potential landing spot, backed by historical onchain volume data and past trading activity.
According to some market pundits, the likelihood of a retest has increased after BTC failed to close above the $107,000 neckline, the same level that triggered bearish reversals in December 2024 and January 2025.
For now, cautious traders pointed to the $101,500 support, which, if broken, could lead to a deeper correction.
When writing, Bitcoin bulls were trying to establish the $104,000 level as a support zone, which, according to popular commentator Rekt Capital, is exactly what needs to happen for a successful post-breakout retest.
In a May 19 post, Rekt Capital noted that holding around $104,400 as support is crucial for Bitcoin to confirm the breakout structure it has been building for months.
The analyst highlighted a repeating pattern on the weekly chart, where BTC historically retests former resistance zones as support before continuing higher.
The $104,000 area now represents the latest key zone in that structure.
 BTC/USD weekly chart. Source: Rekt Capital.
If this level holds, it could pave the way for further upside in the medium term. But if it breaks, the momentum could shift decisively in favour of the bears.
Nevertheless, some traders remained bullish despite the current downturn.
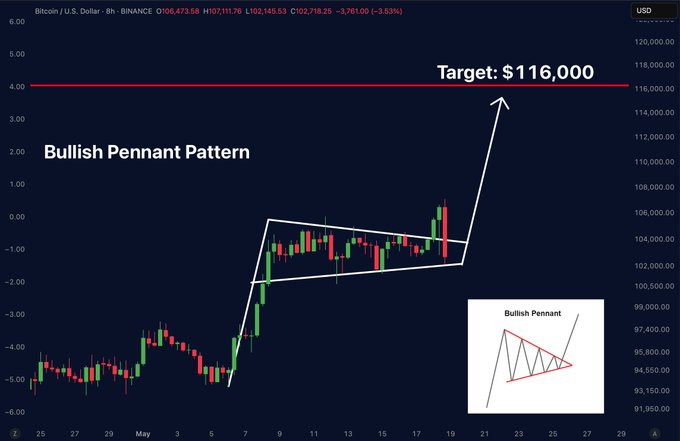
One upside scenario was presented by Merlijn The Trader, who referred to the BTC/USD 8-hour chart and identified a bullish pennant pattern in formation. According to him, as long as the structure holds, Bitcoin could be poised for a breakout toward $116,000.
They shook the tree. Now the rocket’s back on track. As long as structure holds, $BTC target: $116K You either got shaken out… or you’re holding the golden ticket.
Meanwhile, fellow analyst Moralis rejected the idea of a full retrace to $97,000, suggesting that Bitcoin may not offer such a clean retest after all.
 BTC/USD 4-hour chart. Source: Moralis.
According to Moralis, BTC is still respecting this trendline despite the recent pullback, and the market structure remains intact for now.
While many traders are eyeing the $97K zone as a potential support target, Moralis implied that the opportunity may have already passed, with Bitcoin now rebounding above $103,000 at the time of his post.
At press time, Bitcoin was trading at $104,829, down 0.6% over the past 24 hours, as bulls continued to defend key support levels amid lingering market uncertainty.
Altcoins struggle
The broader risk-off sentiment didn’t spare altcoins, which mirrored Bitcoin’s decline.
Over the past 24 hours, the altcoin market cap dipped 3.5% to roughly $1.35 trillion, with the Altcoin Season Index reading slipping from 31 on May 14 to 26 at last check Monday, May 19.
Ethereum (ETH), which stands as the largest altcoin by market share, has dropped 4,% falling below the $2,500 level while other large-cap altcoins leading the market like XRP (XRP), Solana (SOL), Dogecoin (DOGE) and Cardano (ADA) experienced losses ranging from 3-7%.
Some of the high-cap coins that barely managed to remain positive over the past day when writing were Tether Gold (XAUI), PAX Gold (PAXG), and KuCoin Token (KCS), only holding gains lower than 1% each. See below:

Source: CoinMarketCap
The post Bitcoin retests $104K as Moody’s downgrade triggers risk-off sentiment appeared first on Invezz


 English (US) ·