
In this paper, the Bitcoin market is evaluated on a 5-point scale (5 → 1: Strong → Weak) using 1) pattern analysis, 2) moving averages (9MA/25MA), 3) Ichimoku Kinko Hyo, 4) Bollinger Bands, 5) MACD, and 6) RSI’s representative 6 types of technical analysis. and evaluate the strength of the market based on the average.
I believe that fixed-point observation and objectivity are important in technical analysis. The aim is to eliminate arbitrariness and improve accuracy by combining multiple representative analysis methods.
*This article is a reprint of the technical report of “Rakuten Wallet”.
summary
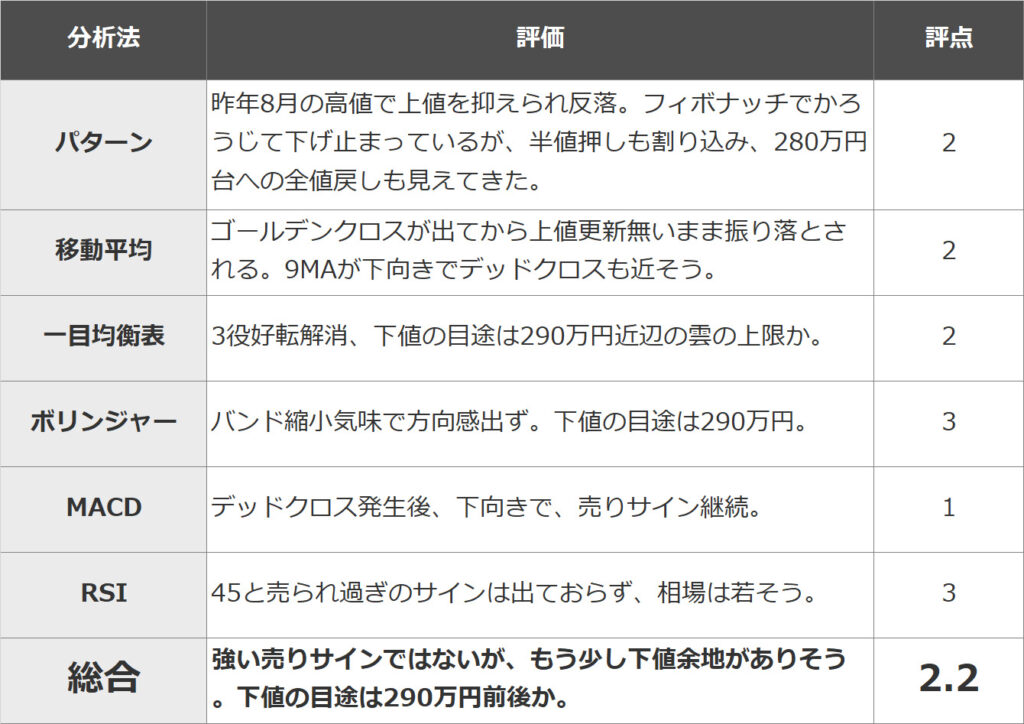
The overall score this time is 2.2 out of 5. It seems to be a rebound from long trades accumulating, even though there were signs of weak buying for the past two weeks. It’s not a strong selling sign, but there seems to be room for further adjustment, and multiple charts indicate that the bottom price is around 2.9 million yen.
pattern analysis
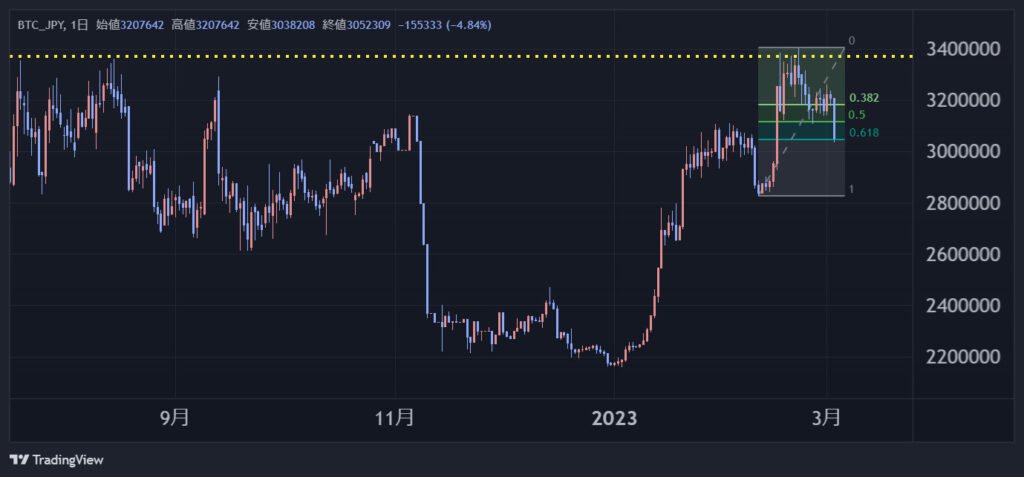
Last August’s return high suppressed the top price, and it was supported by the half-price push of February’s rise, but this morning it broke through the range and broke below the half-price push. It has barely stopped falling at 61.8% of Fibonacci, but we are seeing a full recovery in the mid-2.8 million yen range.
Rating: 2
moving average


Even though a golden cross was formed on the 17th, the top price could hardly be renewed from there, and it was shaken off when long positions were accumulating. The 9MA is downward, and if it stays like this, the dead cross will be close.
Rating: 2
Ichimoku Kinko Hyo
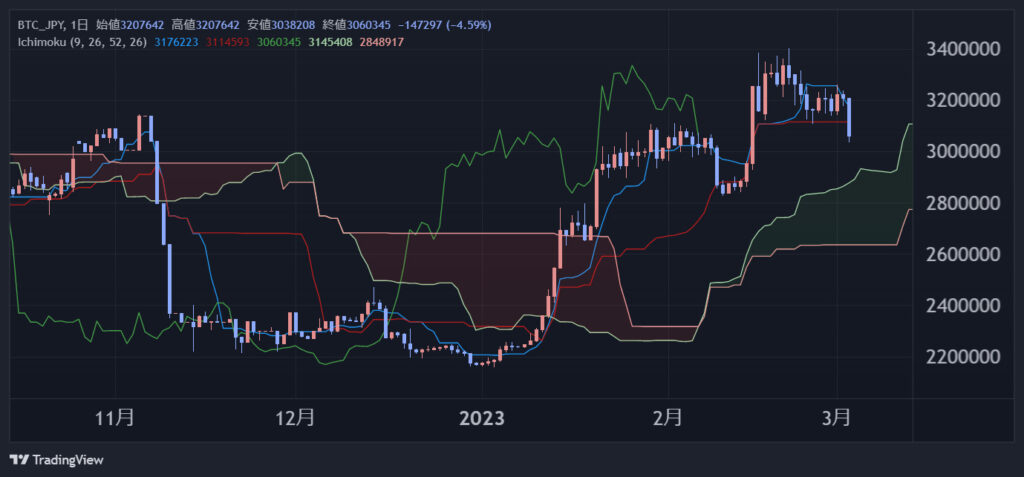

The lagging line overlaps with the candlesticks, and the three-way turnaround is resolved. Candlesticks are below the reference line and it looks like there is a little more downside in the short term. The target for the downside is the 2.9 million yen level, which is the upper limit of the cloud.
Rating: 2
bollinger bands
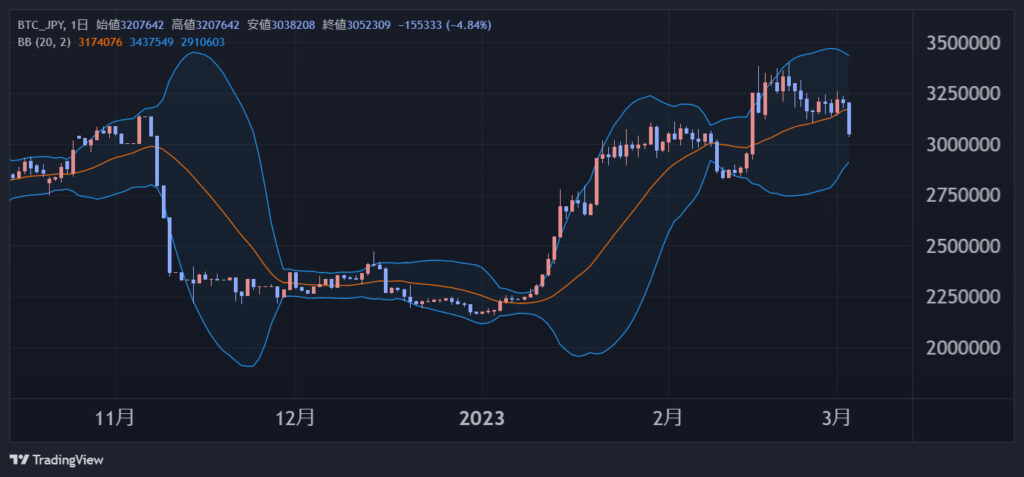

It seemed to move from squeeze to expansion, but the band shrank again. There is no sense of direction, but it seems to be supported around 2.9 million yen, which is 2σ.
Rating: 3
MACD
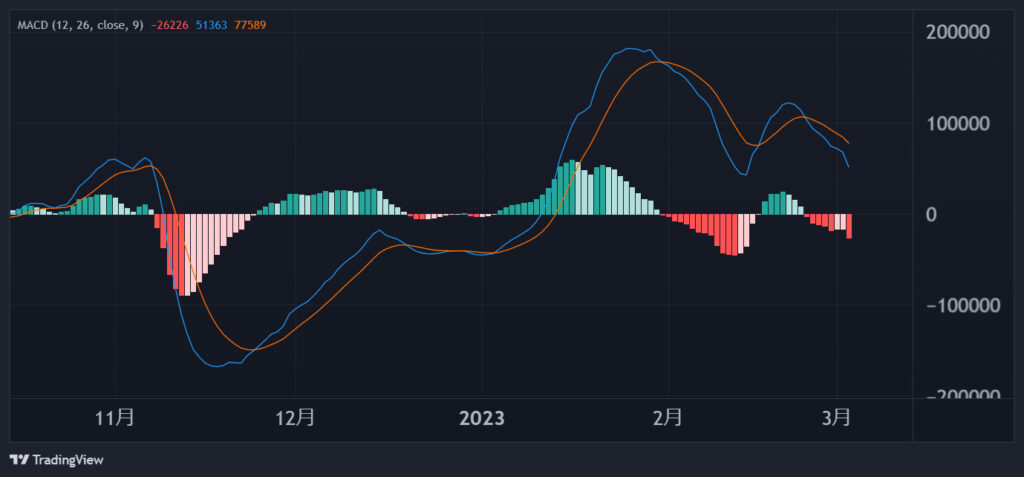

A dead cross occurred on the 24th, and both lines continued to trend downward after that.
Rating: 1
RSI
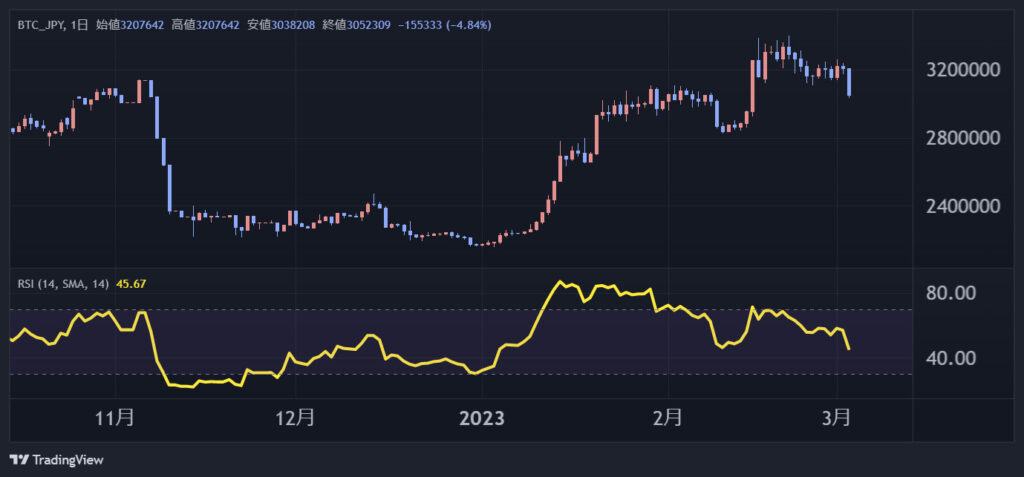

The RSI is 45 and neither buy nor sell signs are showing, and the market looks young.
Rating: 3

Yasuo Matsuda
Rakuten Wallet Senior Analyst
Majored in the international monetary system at the Faculty of Economics, University of Tokyo. He is engaged in foreign exchange and bond sales and trading at Mitsubishi UFJ Bank and Deutsche Bank Group. Since 2018, she has been engaged in analyzing and forecasting the crypto-asset market at a crypto-asset exchange company, and has almost hit the target of 8 million yen peak in 2021 and 5 million yen at the end of the year. Current position from January 2022.
*This article provides information for reference in making investment decisions, but is not intended to recommend stocks or solicit investment activities. In addition, Rakuten Wallet does not solicit investment or make definitive forecasts.
*The information posted may include future forecasts, but these are the views of the individual sender, and we do not guarantee their accuracy or reliability. Please make your own final investment decisions.
| Editing: coindesk JAPAN
|Image: Rakuten Wallet
|Reprinted from: https://www.rakuten-wallet.co.jp/market/market-list/2023/030302/
The post Bitcoin, Technical Analysis by Matrix Method (2023/3/3): Rakuten Wallet | coindesk JAPAN | Coindesk Japan appeared first on Our Bitcoin News.

 2 years ago
101


 English (US) ·