The post Cardano Price To Retrace $0.5 Level Before Any Bullish Reversal! What Next For ADA Price? appeared first on Coinpedia - Fintech & Cryptocurreny News Media| Crypto Guide
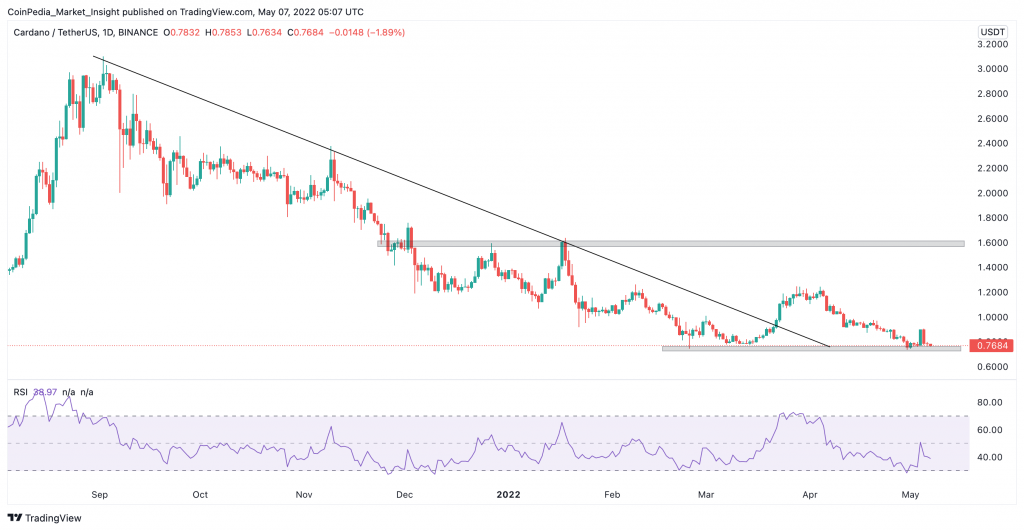
Since achieving an all-time high of $3.10 on September 2, ADA has been declining beneath a descending resistance line. On February 24, the price fell to a low of $0.74.
After that, cardano price regained its footing and broke free from the line on March 23. However, the increasing trend could not be maintained, and the price fell to $0.70 in early May. This generated a double bottom in comparison to the price in March, which is a bullish pattern.
If this pattern results in an upward trend, the nearest resistance region would be at $1.55.
Cardano Bullish Pattern
Despite the fact that the double bottom is a bullish pattern, it has yet to be accompanied by positive divergence in the RSI or MACD. Both indicators, on the other hand, are declining and giving negative indications.
More crucially, the RSI’s declining trendline remains intact, indicating that the trend is bearish.
Despite the bearishness on higher time frames, the six-hour chart implies a possible short-term comeback.

This is because ADA has broken out of a short-term descending resistance line and is in the process of confirming it as support.
If the price continues to rise, resistance will be found between $0.93 and $0.99. These are the Fib retracement resistance levels of 0.382 to 0.5.
Also Read : Cardano (ADA) Price Might Rally 2x in 2022 With Institutional Demand
ADA/BTC
The ADA/BTC pair is bullish compared to the USD pair. The fundamental reason for this is that a bullish divergence in the MACD has been combined with a double bottom in the daily time frame (green line).
The RSI has also broken through its declining trendline and is now seeking to climb above 50. As a result, an upward trend towards the yearly highs of 2,600 satoshis as possible.

 3 years ago
201


 English (US) ·