
The post Crypto Industry Records A Successful Uptober! How Will The Market Perform This Month? appeared first on Coinpedia Fintech News
The crypto industry displayed a massive price action in October, as Bitcoin and major altcoins have added significant value to their portfolios. The total Marketcap jumped from $1.05T to $1.26T, a 20% increase in value.
Bitcoin displayed a significant movement in its price during October. The star crypto added 28.51% in value this month, making it the second most bullish month of the year.
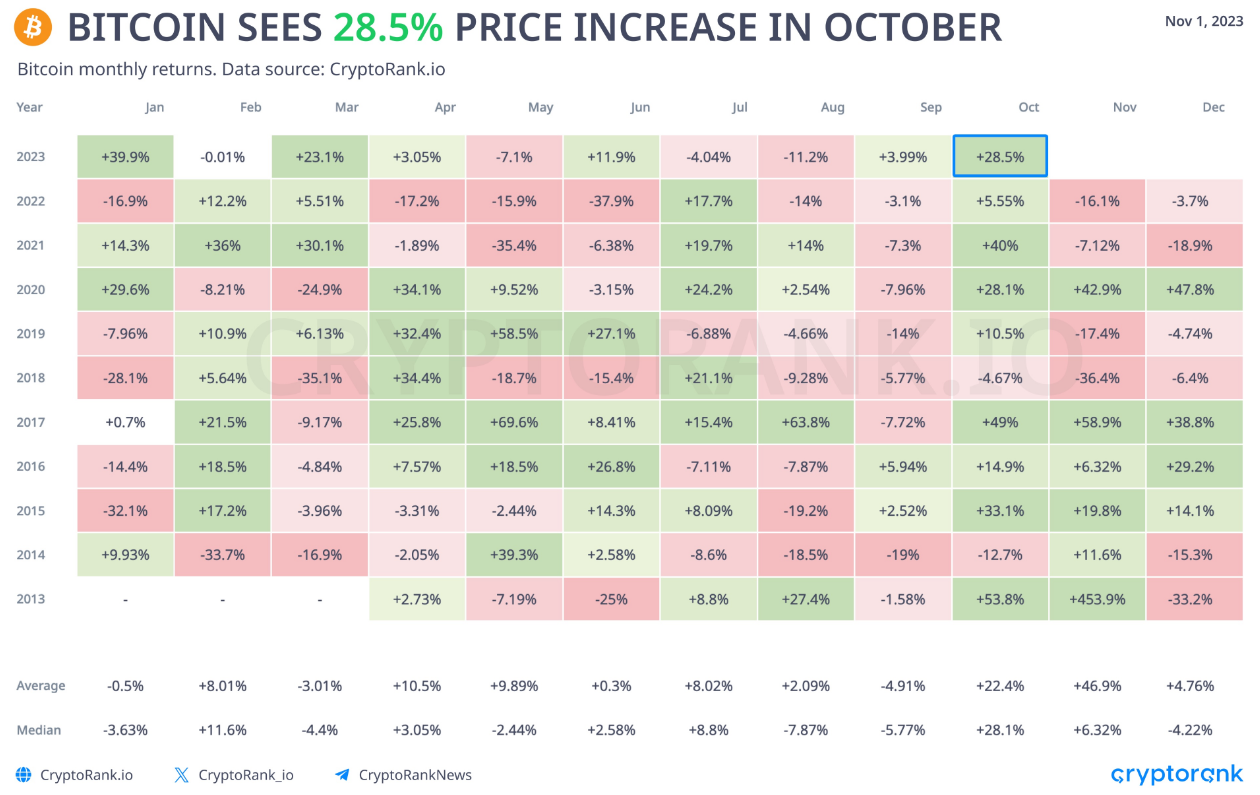 Source: Cryptorank
The Ethereum price followed the footsteps of the market leader and displayed a massive price action during October. The price gained over 10% in value during the price pump and added around 5% compared to the previous month.
Bitcoin Price Analysis:
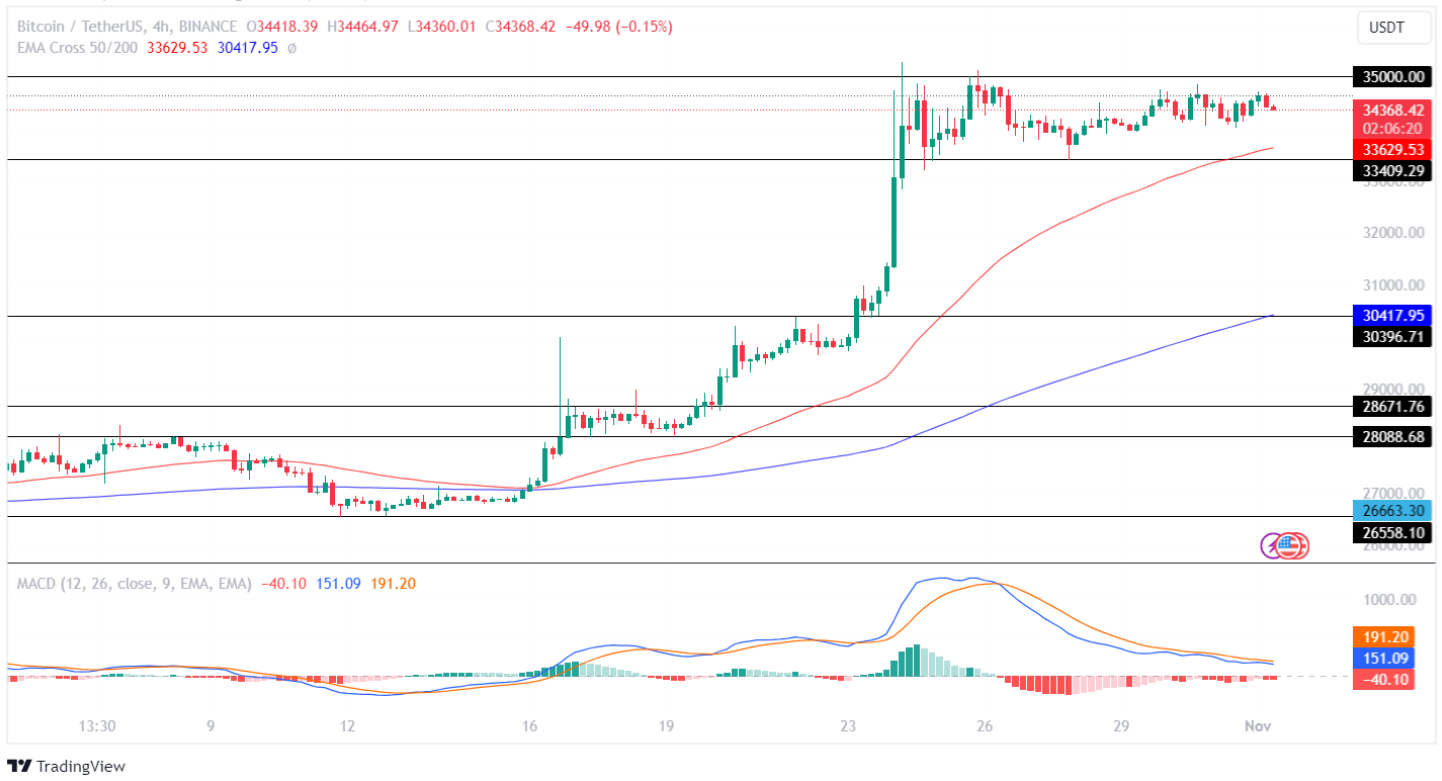
The Bitcoin price struggled to break out of its key resistance level at $28,000 for a brief period as the bulls constantly failed to gain momentum. Following the market pump, BTC not only broke out of its key resistance but also broke out of its major resistance level of $31,000.
The price of Bitcoin managed to achieve its $35,000 mark, but for a very short period, the rally was short-lived, and the market experienced a pullback in its value. Since then, the price has been trading in a consolidated range of $33,409.29 and $35,000 and is expected to retest the upper level this month.
 TradingView: BTC/USDT
The MACD displays a constant red histogram for over a week, indicating a bearish influence in the market. Further, the averages show a possibility of a bullish convergence soon, suggesting the price will bounce back in the coming days.
If the bulls push the BTC price above the resistance level of $35,000, the star crypto will regain momentum and make a run to test its upper resistance of $35,550 soon. Further, if the bulls continue to hold the price at that level, it will prepare to test its resistance level of $36,270 in the coming days.
Conversely, if the bears overpower the bulls and the BTC price breaks down the support level at $33,409.29, the price will start trading under a bearish influence, resulting in the price testing its lower support level of $30,396.71 this month.
Ethereum Price Analysis:
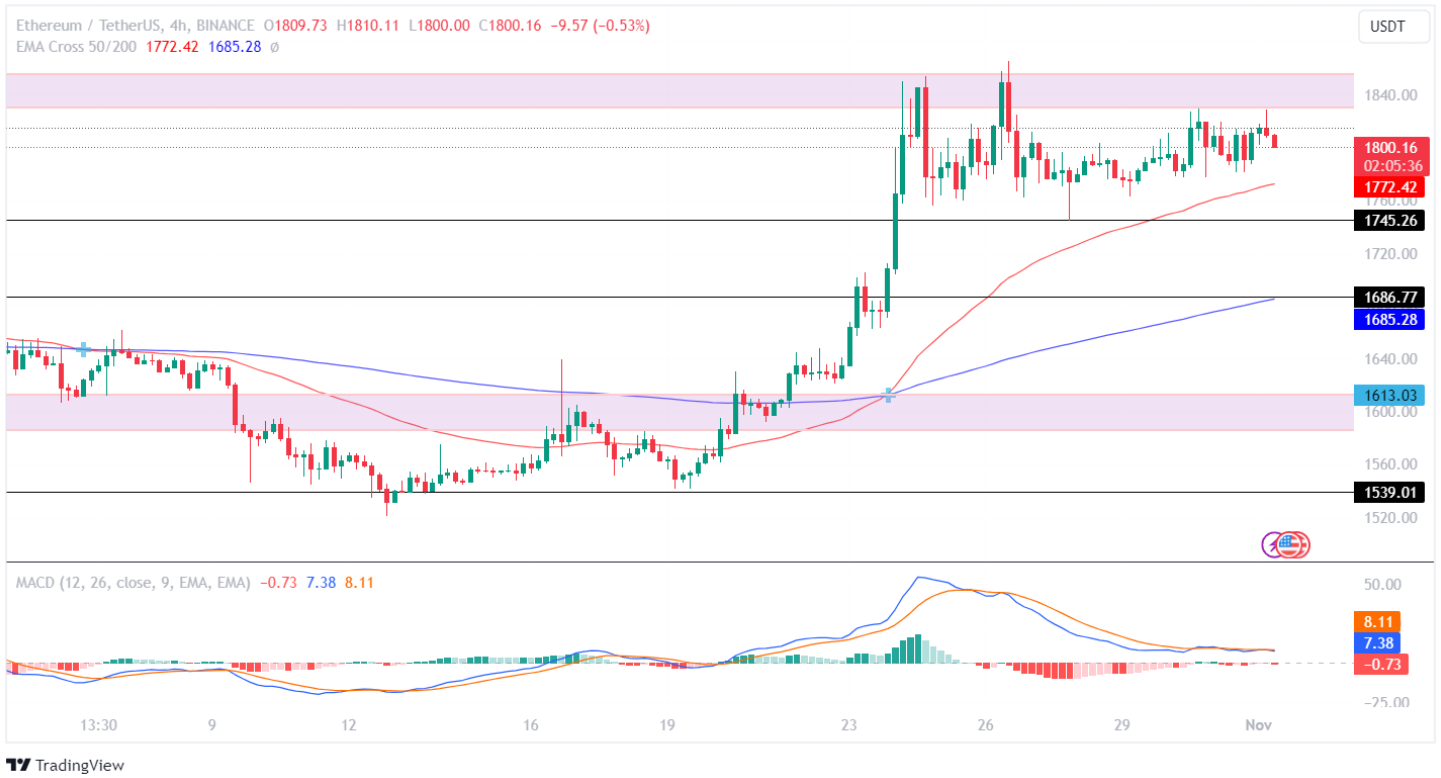
The ETH price was trading between $1,539.01 and $1,612.74 for over a week. Following the market pump, the price gained momentum and broke out of multiple resistance levels.
Further, the Ethereum price attempted to break out of its key resistance at $1,850, but the price was rejected as the bears overpowered the buying power. Since then, the price has been trading in a consolidated range between $1,745.26 and $1,850.
 TradingView: ETH/USDT
The MACD has displayed a strong red histogram following the market pump. Further, the histogram traded flat for three days, indicating uncertainty in the future price action of the coin. The averages, however, show a possible bullish convergence, suggesting the ETH price will gain momentum this month.
If the bulls break out of the resistance zone at $1,850, the price will regain momentum and make a run to test its upper resistance of $1,940 soon. Further, if the bulls continue to hold price at that level, it will make a run to test its $2,000 by the month-end.
On the flip side, if the bears gain momentum and a trend reversal occurs, the ETH price will lose its hold and fall to test its support level of $1,745.26. Moreover, if the bears continue to dominate the market, Ethereum will experience a plunge in its value and test its lower support level of $1,686.77 in the coming week.
Conclusion:
The crypto market has started trading the month of November on a strong bullish note as the market sentiments indicate another price surge before concluding the year.
Major cryptocurrencies have managed to break out of their respective important resistance levels, highlighting a promising uptrend for these coins in the future.


 English (US) ·