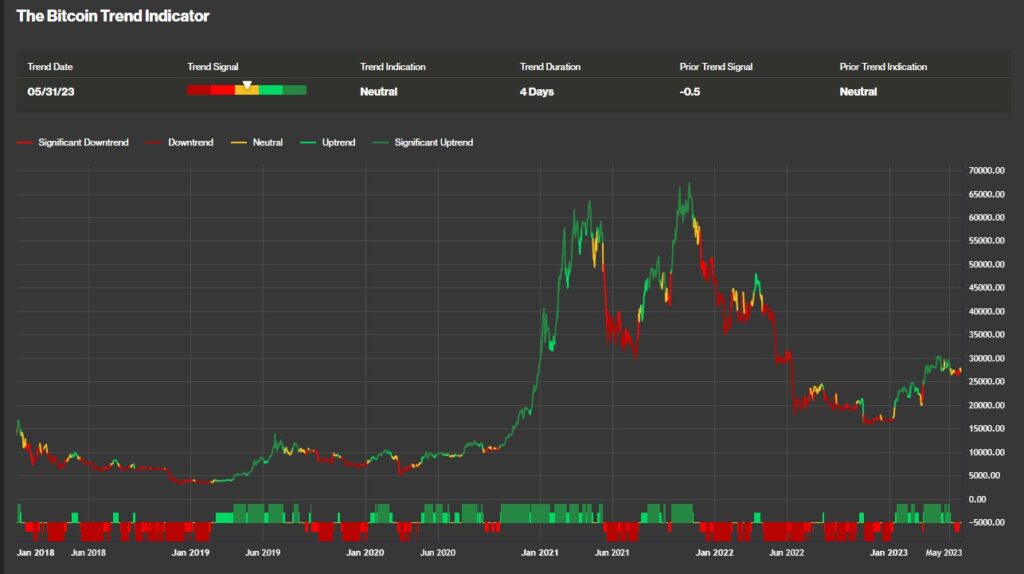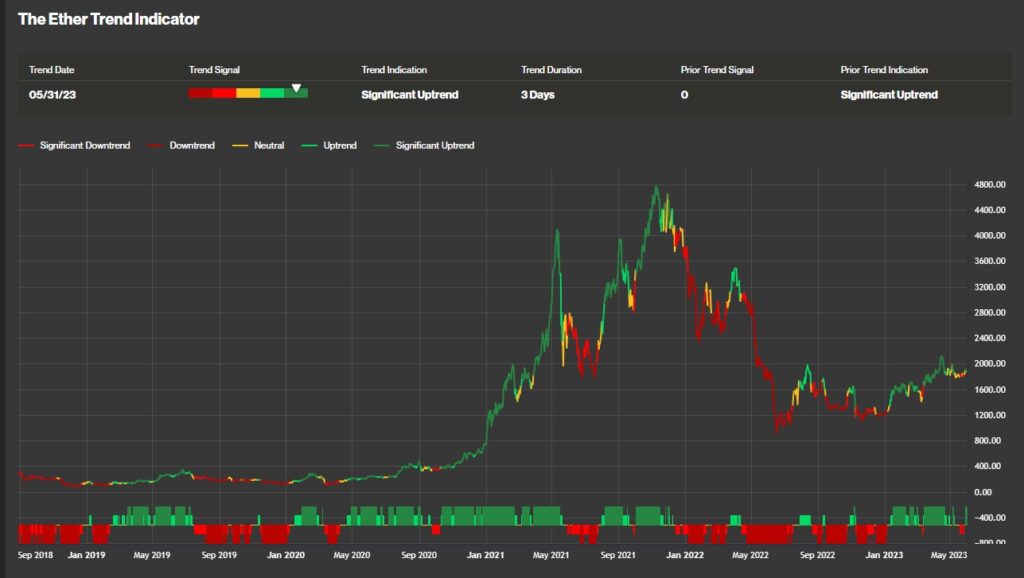
Bitcoin (BTC) and Ethereum (ETH) saw their first declines in 2023 in May, but they also started June lower. But despite similar price movements, the CoinDesk Indices Trend Indicator shows a difference in short-term direction.
The Bitcoin Trend Indicator (BTI) is a “neutral” signal while the Ether Trend Indicator (ETI) is showing a “significant uptrend.”
 Bitcoin Trend Indicator
This indicator shows the direction and strength of momentum in asset prices. Every day, it generates 5 signals ranging from “significant downtrend” to “significant uptrend”.
Ethereum trend moved from “neutral” to “significant uptrend” three days ago. Bitcoin turned from a “downtrend” to “neutral” four days ago.

 Ether Trend Indicator
The gap between Bitcoin and Ethereum is closing
A longer-term view of the Ethereum chart shows a general uptrend after November 2022 and a 55% gain so far in 2023.
Bitcoin’s 62% year-to-date gain is still outpacing Ethereum, but in May, Ethereum was largely flat while Bitcoin fell nearly 8%. That gap has narrowed over the past month, with the ETH/BTC ratio up 8.2% since April 30.
Ethereum bulls will also point to the shrinking supply of 274,000 ETH after September 2022 as a factor.
On-chain data shows investors remain bullish on Ethereum. Ethereum futures funding rates have been positive for all but two days since April 7. A positive funding rate indicates bullish investor sentiment, a negative one indicates bearish.
Bitcoin’s funding rate also remains positive, indicating continued bullish sentiment despite the recent price drop.
|Translation: coindesk JAPAN
|Editing: Takayuki Masuda
|Image: Shutterstock
|Original: On Heels of First Losing Month of 2023, Bitcoin and Ether Flash Differing Signals
The post Different signals for Bitcoin and Ethereum ──Both fell for the first time this year in May | coindesk JAPAN | Coindesk Japan appeared first on Our Bitcoin News.

 2 years ago
93


 English (US) ·