
The post Dogecoin Price Analysis: Will the Golden Cross Signal a 200% Surge? appeared first on Coinpedia Fintech News
On October 19, the price of Dogecoin was $0.14408. Since then, it has dropped 7.09%. Meanwhile, the Dogecoin price of $0.13440 5]remains well above its 200-day SMA of 0.12758 on the daily chart. The price momentum of Dogecoin shows mixed signals, with some indicators suggesting a downturn while others hint at a significant rally. Let’s break down what analysts predict about the next big move of Dogecoin! Ready? Dive in!
Is Dogecoin Losing Momentum?
At the start of the month, the price of Dogecoin was $0.11413. Till October 13, the market moved sideways momentum, struggling to break about the opening price of October 1. Looking at the daily chart of Dogecoin, a Doji candlestick formed on the thirteenth of this month, indicating a tight tug-of-war between buyers and sellers on that day.
Marking the success of buyers over sellers, on October 14, buyers pushed the price above the opening price of October 1 to a high of $0.11658. On October 19, the DOGE price touched a monthly peak of $0.14408. Between October 13 and 19, the market saw a surge of at least 29.44%. Now, the price stands at $0.13488 – nearly 7.09% lower than the monthly peak of October 19.
Growing Bearish Pressure Signals Weak Fundamentals
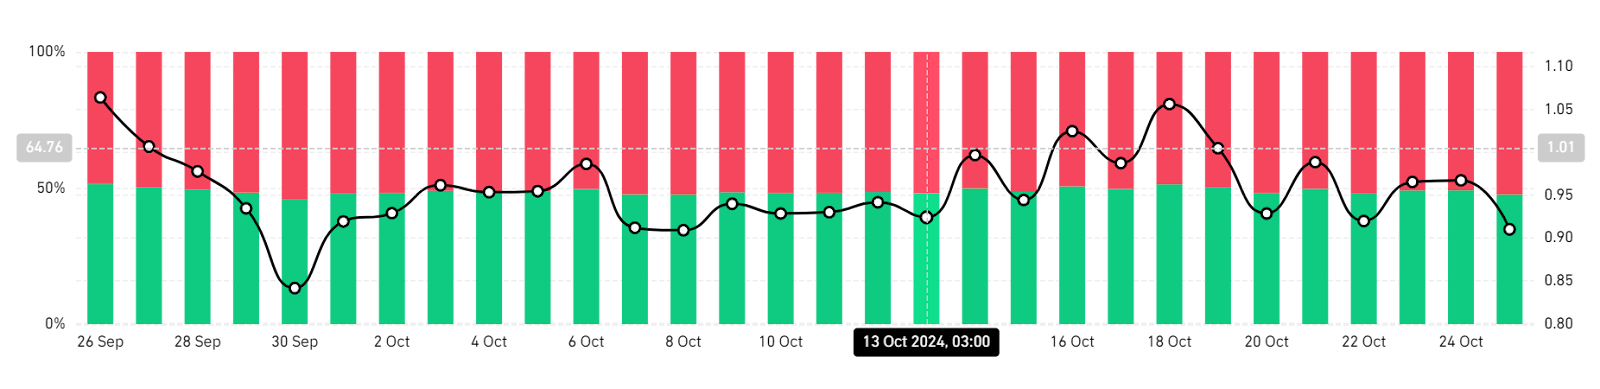
Data from Coinglass suggests that 52.35% of investors have opted for short positions in the last 24 hours. It is when an investor expects a drop in price that he/she takes a short position. This means that more investors foresee a near-term drop in the price of DOGE.
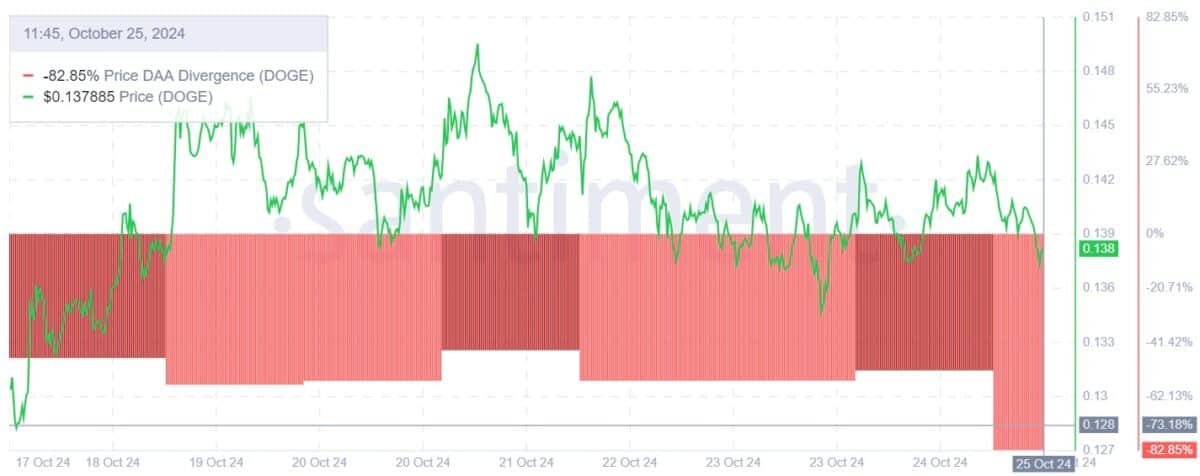
Notably, the DAA divergence of the DOGE price also points to a weakening of bullish momentum, as it has remained negative over the past week.
Some crypto analysts believe that if the new bearish trend holds, the DOGE market could drop further.
DMI and MA Golden Cross Sigal A Major Rally
Applying the Directional Momentum Indicator to the daily chart of DOGE indicates a bullish trend. The +DI value of 25.9254 sits above the -DI value of 15.7939, and the ADX index of 30.9689 remains at least 5 points higher than the +DI value. The ADX line rises above both the +DI and -DI lines while the +DI line remains above the -DI line indicating a strong bullish signal.
Likewise, the price of Dogecoin broke through the 200-day SMA on October 18 on the daily chart. Still, the price remains above the said SMA line. The 50-day SMA line is converging towards the 200-day SMA line, and the shorter moving average is expected to cross above the longer moving average, creating a golden cross signal soon.
The potential for a golden cross is even clearer in the weekly chart of Dogecoin.
- Also Read :
- Top 5 Memecoins To Watch During This Crypto Dip!
- ,
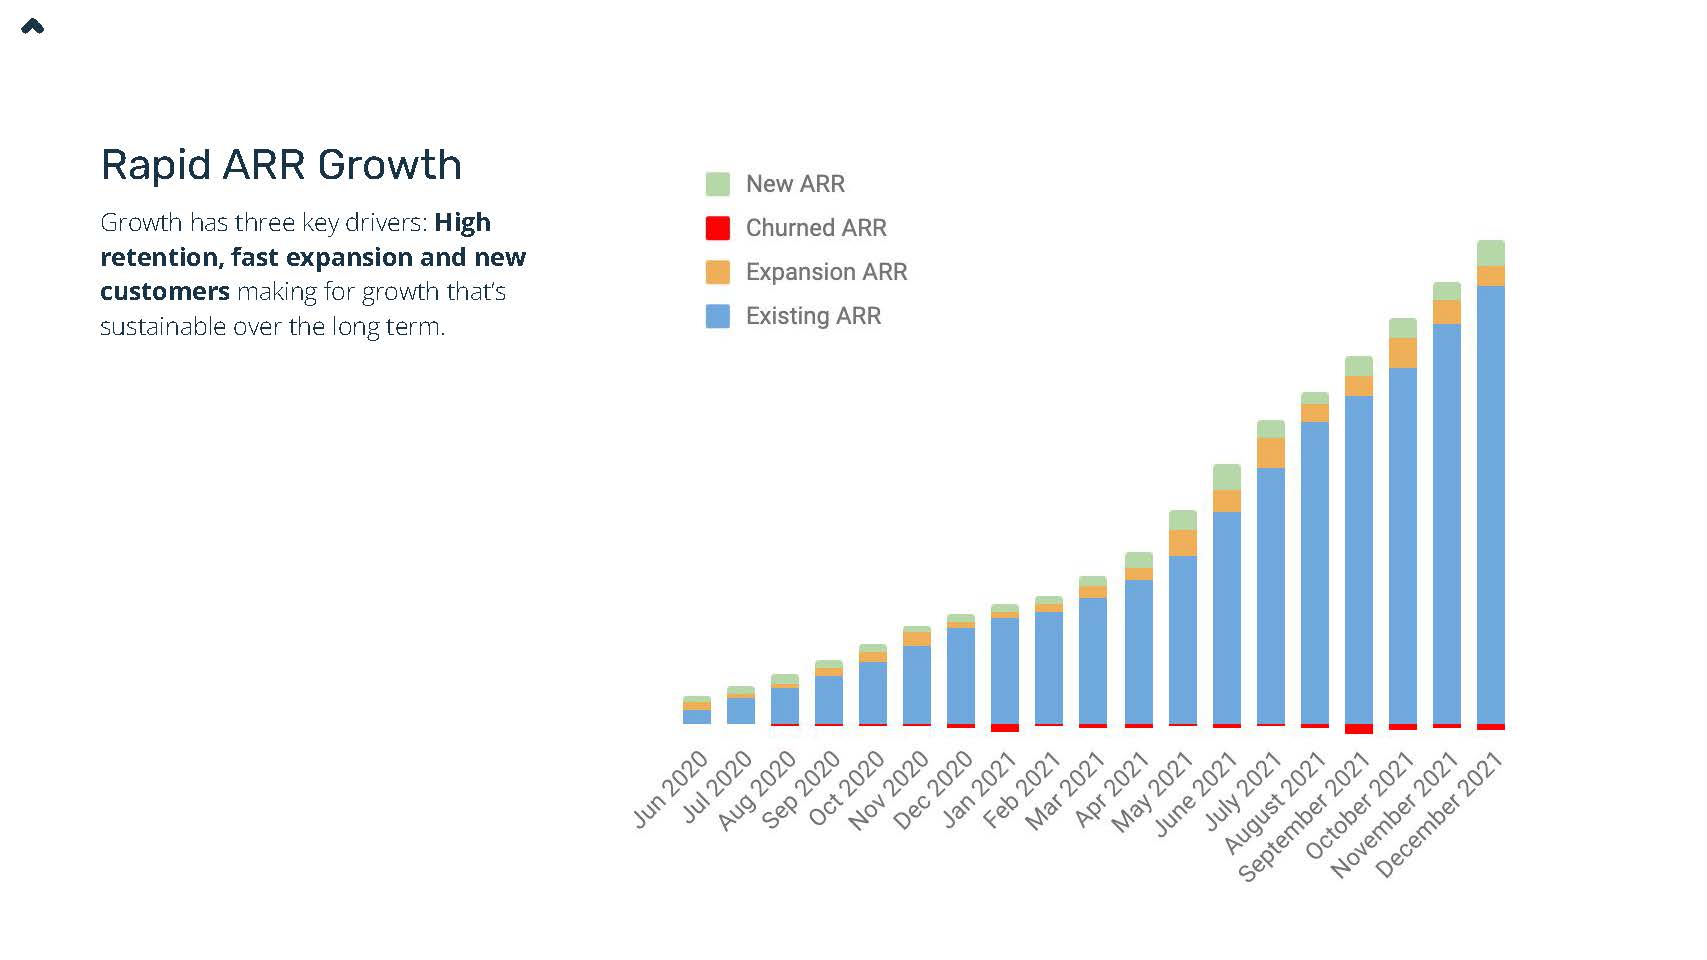
The Golden Cross is widely viewed as an extremely powerful bullish signal. It was in 2021 that Dogecoin last experienced this signal. Then, it resulted in a massive bullish rally.
Some analysts predict if the price of DOGE holds its position above the 200-week SMA, it could rally up to 200%.
In conclusion, Dogecoin is at a crucial point, with indicators pointing to both bearish and bullish trends.
Stay tuned to Coinpedia for the latest updates on Dogecoin’s price momentum!


 English (US) ·