
The post Ethereum Breakdown Confirmed! ETH Price To Retest $2.8K This Week? appeared first on Coinpedia Fintech News
The cryptocurrency market has displayed a strong bearish action since the week started, highlighting an increase in the selling-over-buying pressure. Further, the market leader, Bitcoin price has dropped approximately 3% over the past day, suggesting a negative outlook.
Following this, the altcoin leader, Ethereum price has recorded a similar price action by recording a correction of 4.38% in valuation with a trading volume of $18.61 Billion. With the present market sentiments, will ETH price record a bullish reversal or plunge toward its crucial support level of $2,800?
ETH Price Breaks Down Its Important Support Trendline:
The Ethereum token has formed a multi-pattern in its 1D time frame and has continued to trade within it for a brief period. Notably, the altcoin has been trading with a descending channel pattern since mid-May, highlighting a long-term bearish sentiment.
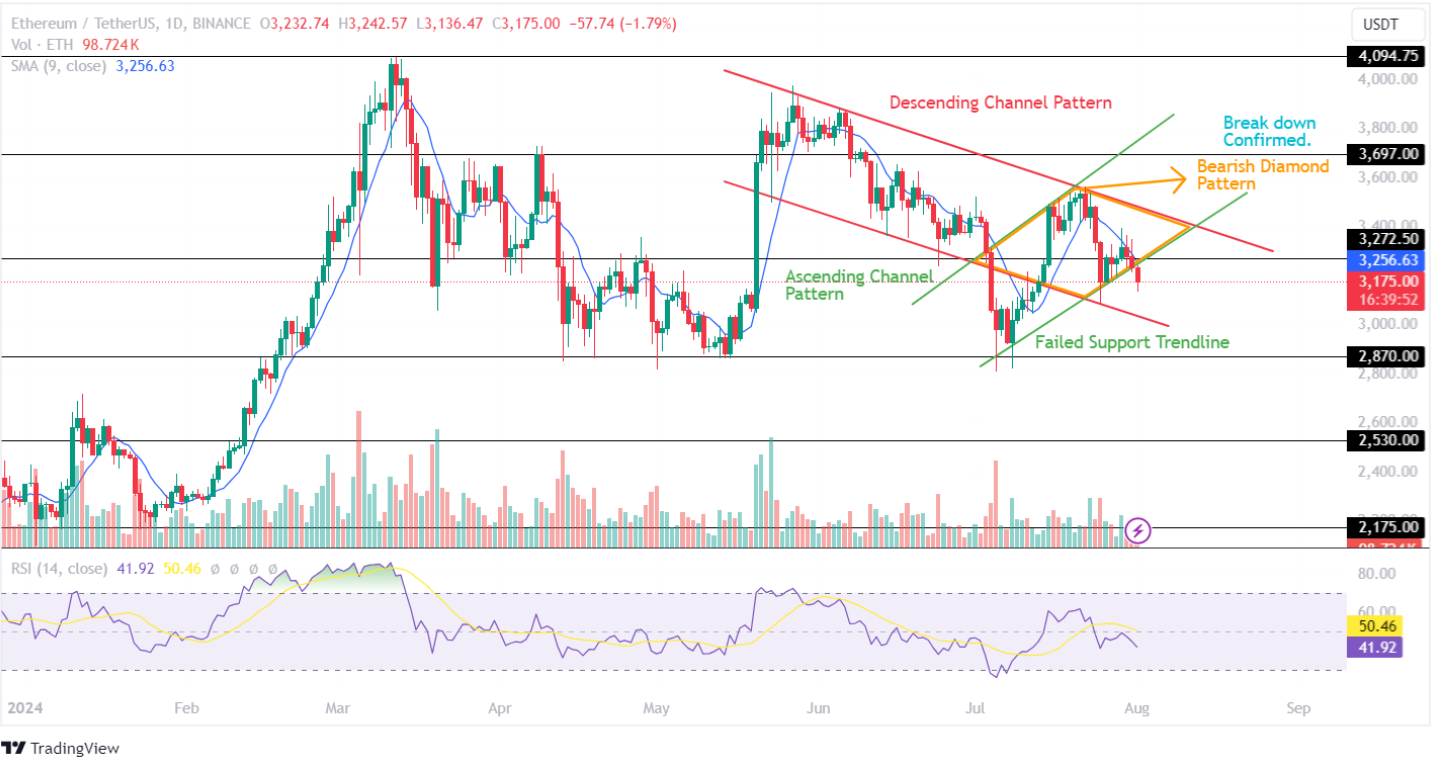 TradingView: ETH/USDT
However, with the increased price volatility in the crypto space during July, the ETH token formed an ascending channel pattern after successfully retesting its crucial support level of $2,800.
This has further resulted in the Ethereum crypto forming a bearish diamond-shaped pattern in the price chart. With the recent cross-border market correction, the altcoin has recorded a breakdown during the early trading hours today.
Ethereum (ETH) Market Sentiments:
The Simple Moving Average (SMA) constantly acts as a resistance to the ETH price chart in the 1D time frame, highlighting an increase in the bearish sentiment within the crypto space.
Further, the technical indicator, RSI, has failed to surpass its neutral point with its average trendline recording a bearish curve. This indicates a negative outlook for the altcoin leader during the upcoming days.
Analyzing Market Trend Of Ethereum Spot ETFs:
Grayscale’s “ETH” recorded the highest inflow of $19.8 Million, followed by Fidelity’s “FETH” with $18.8 Million. Blackrock’s “ETHA” records an inflow of $5 Million, whereas 21 Shares “CETH”, VanEck’s “ETHV”, and Bitwise’s “ETHW” record inflows worth $3.3 Million, $4.8 Million, and $4.7 Million respectively.
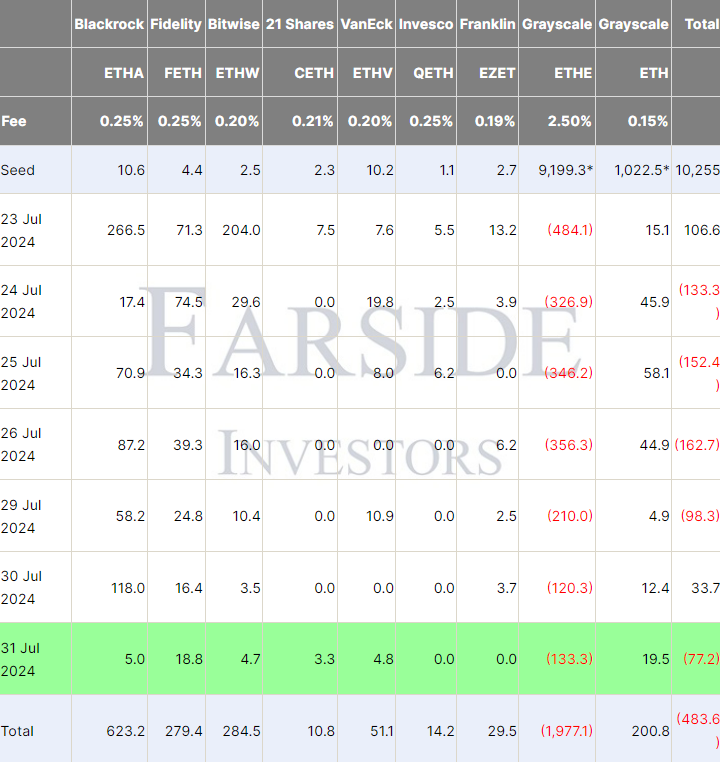 Source: FARSIDE Investors
Further, Invesco’s “QETH” and Franklin’s “EZET” record a neutral flow. Conversely, Grayscale’s “ETHE” has recorded an outflow of $133.3 Million. With an outflow of $77.2 Million, the Ethereum ETFs have recorded outflows for 5/7 days.
Notably, 8 out of 9 ETFs have recorded a positive flow since the Ethereum ETF launch totaling $1,493.5 Million. However, with an outflow of $1,977.1 Million by Grayscale’s “ETHE”, the total flow of ETH ETF stands at (-)$483.6 Million.
Will ETH Price Boon Again?
If the market regains momentum, the Ethereum coin price will prepare to retest its resistance level of $3,300. Moreover, with increasing bullish sentiment in the crypto space, the ETH token could break out of its descending channel pattern and head toward its upper level of $3.7K.
However, if the bears continue to dominate the cryptocurrency market, this could result in the Ethereum (ETH) price plunging toward its crucial support level of $2,800 this month.


 English (US) ·