
The post Ethereum Prepares for 10% Drop As Supply on Exchanges Rises: Here’s the Next ETH Price Trend appeared first on Coinpedia Fintech News
Ethereum has had a turbulent start to the week, and data suggests that further declines may be on the way. As Bitcoin loses momentum and drops below immediate support levels in recent hours, selling pressure on Ethereum is increasing. This downward trend is reinforced by various on-chain metrics, which now point to a potential sharp 10% drop for Ethereum in the coming hours.
Ethereum Eyes for 10% Drop
According to data from Coinglass, Ethereum liquidations have surged significantly, surpassing $42.7 million in total. Of this amount, approximately $40 million resulted from the liquidation of long positions.
A bearish indicator is the increasing supply of ETH on exchanges. According to additional data from CryptoQuant, Ether balances on exchanges reached a four-week high of 15.8 million ETH on October 21. The net balance between inflows and outflows among centralized exchange wallets shows a sharp increase between October 15 and October 20, when deposits to trading platforms began to surge.
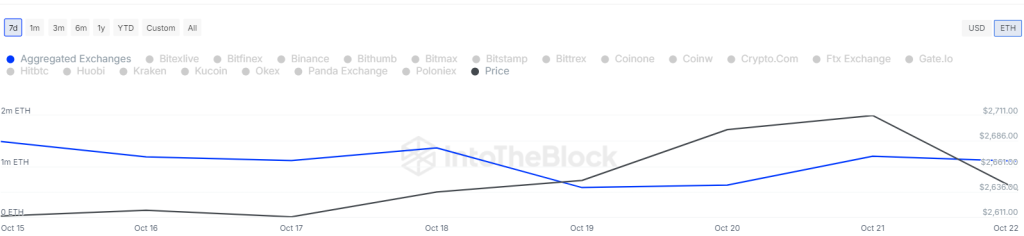
An increasing ETH supply on exchanges suggests that investors are transferring their tokens from self-custody wallets to exchanges, indicating an intention to sell.
Additionally, since mid-June, Ethereum’s total value locked (TVL) has been decreasing, as shown in DefiLlama’s chart below.
The TVL on the layer-1 network dropped from a year-to-date peak of $66 billion on June 3, declining 57% to $42.3 billion by August 5, before rising to the current level of $48 billion. Additional data from DefiLlama indicates that Ethereum’s TVL has decreased by over 2% in the last 30 days, underperforming other top layer-1 protocols like Solana, which has seen a 22% increase in TVL during the same period.
The rising TVL in Solana reflects traders’ interest in its DeFi ecosystem and highlights Ethereum’s inability to attract new users due to its relatively higher transaction costs, especially for those looking to launch new projects.
This has intensified bearish dominance in Ethereum’s price chart, pushing the price toward a potential 10% drop.
What’s Next for ETH Price?
Ether price faced a strong selling pressure as bears dominated the price around $2,800, indicating that the market had rejected the previous breakout. The selling pressure increased, causing the price to drop below the 200-day Exponential Moving Average (EMA) at $2,552. As of writing, ETH price trades at $2,517, declining over 4% in the last 24 hours.
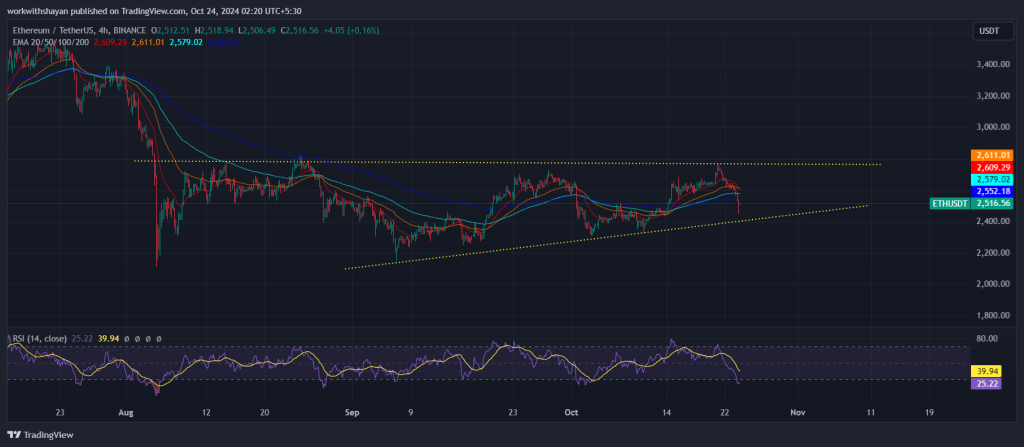
There’s minor support at the 50-day Simple Moving Average (SMA) of $2,487; however, if this level doesn’t hold, the ETH/USDT pair could fall to $2,400 and subsequently to $2,330.
Conversely, if the price bounces off the 50-day SMA, it would suggest strong demand at lower price levels. In that case, the bulls may attempt to push the price up to $2,850, which is likely to serve as a significant resistance barrier.
As the RSI level is approaching the oversold region, we might soon see a rebound in the ETH price chart.


 English (US) ·