The post Is The Correction Phase Ending For AI Coins? appeared first on Coinpedia Fintech News
With the broader market lacking bullish momentum, investors are searching for altcoins with high reversal possibilities. Amidst the altcoins, the AI coins are projecting a high likelihood of a turnaround this week.
With crucial support levels at play, the AI coins are preparing a bounceback rally that could spark a new relief rally. Will the uptrend for such altcoins sustain the broader market slowdown?
Well, to answer such questions and find out if it’s worth buying AI coins in May, let’s examine their price charts with technical analysis.
Will This Top AI Coin Price Sustain Above $2?
With the bulls struggling to sustain the uptrend in Fetch.AI, the FET token price consolidates above $2. The sideways shift in the FET price trend puts the $2 psychological mark at risk.
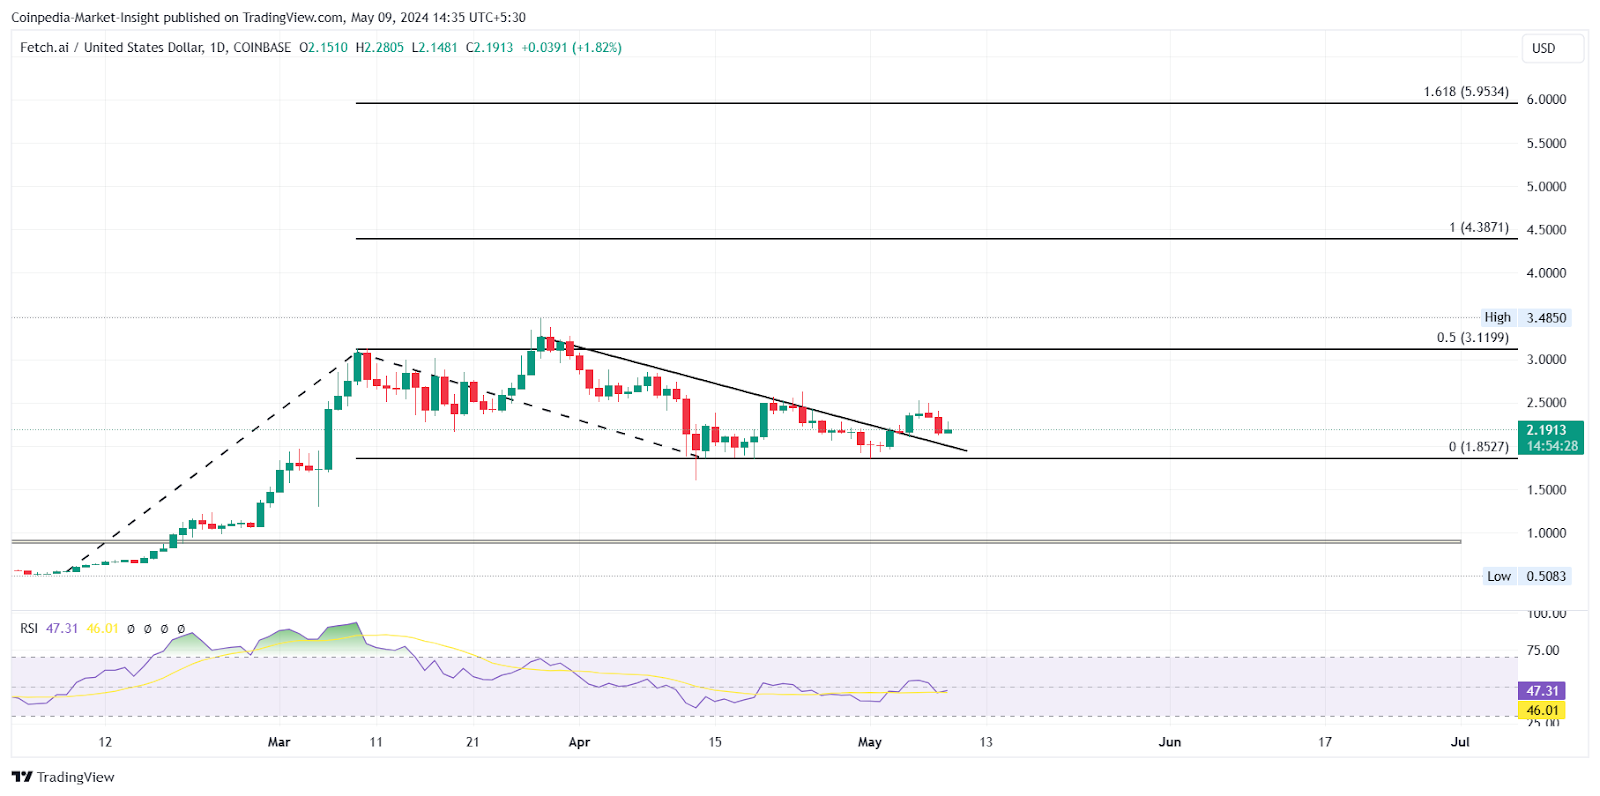
The FET price breaks the resistance trendline and performs a retest with an evening star. With the rising RSI line reflecting an increase in demand, the post-retest reversal chances are high.
A post-retest reversal could pump the AI coin price to $5.9 or the 1.618 trend-based Fibonacci level.
Will AIOZ Price Pump With This Breakout?
With an ongoing bullish uprising in the AIOZ token price, the price chart projects a turningaround for this AI coin. As the bulls outgrow the falling channel pattern of the short-term pullback, the breakout rally results in a rounding bottom reversal.
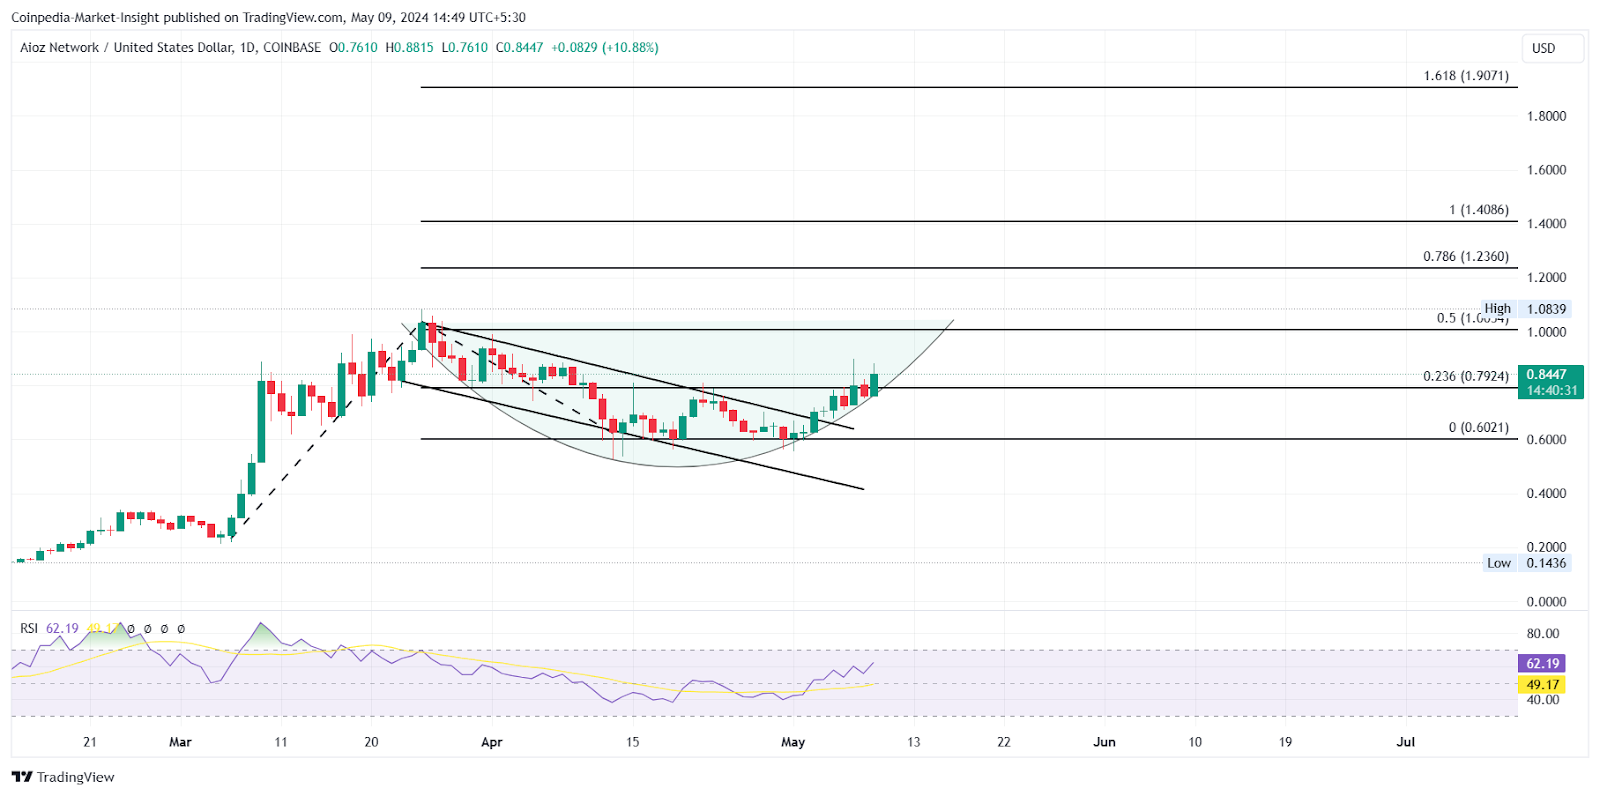
With a 36% growth in the last eight days, the rising momentum in the AIOZ price trend heads to challenge the $1 psychological mark. Further, the daily RSI line is on the rise, reflecting a growth in demand.
If the uptrend in the AIOZ token surpasses the neckline at the psychological mark of $1, the AI coin price could reach the $1.40 mark. Further, as per the trend-based Fibonacci levels, the uptrend could scale to $1.90 this month.
AGIX Price Struggles Under $1
Trapped in a triangle pattern, the AGIX price chart shows the trend momentum coiling up. Further, the resonating token price within this triangle violates the $1 mark and its importance.
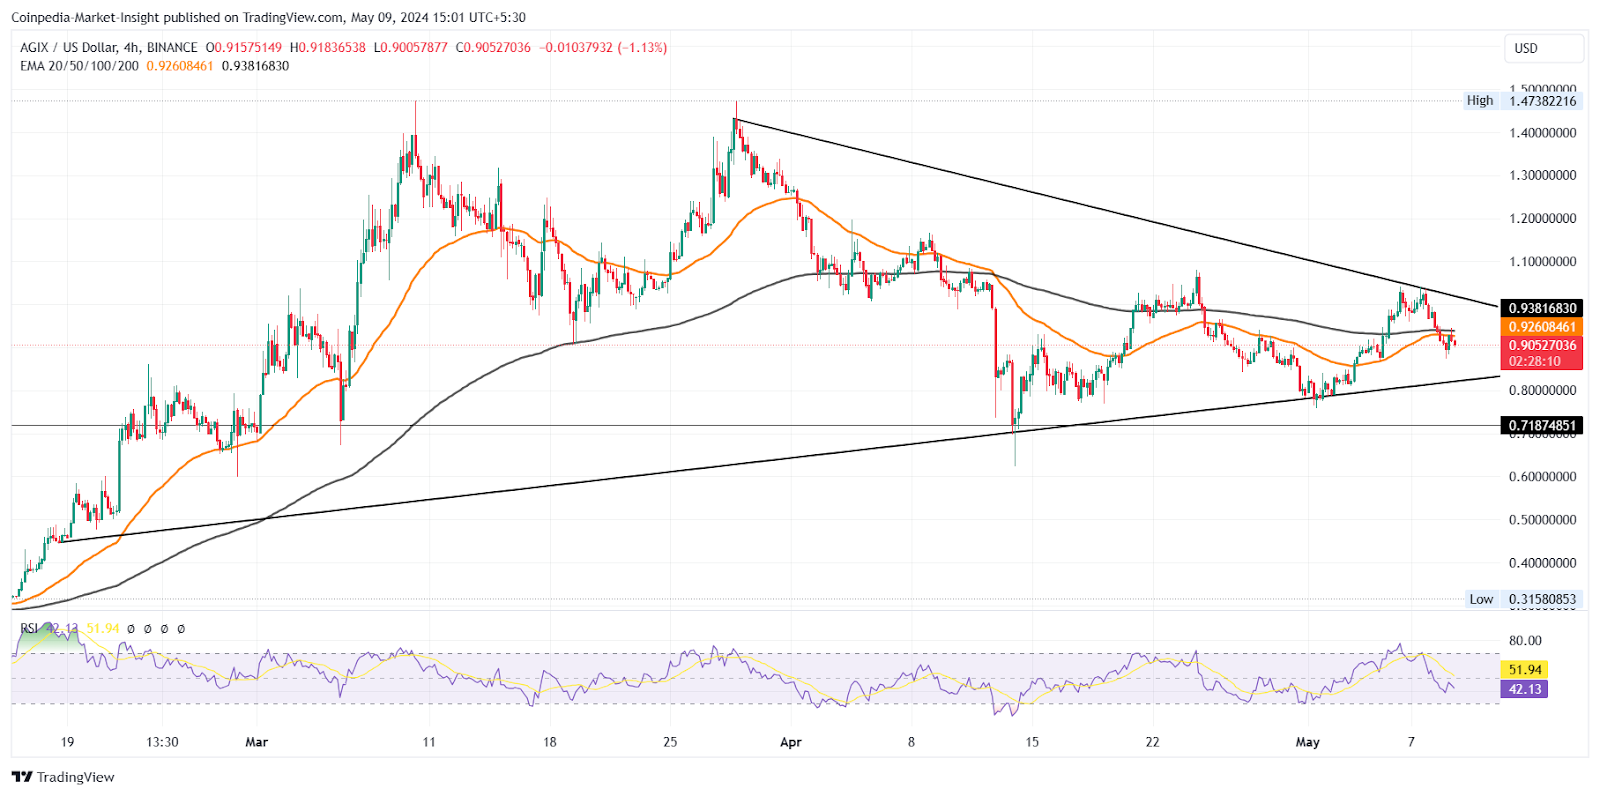
The 4H chart shows the 50 and 200 EMA struggling to regain the positive alignment. Further, the RSI line is heading to the oversold boundary in the 4H chart.
Considering that a sector-wide recovery would give additional bullish momentum to Singularity.NET, the AGIX price could surpass the overhead trendline. With a bullish breakout of the triangle pattern, the AI coin price could reach the $1.35 mark.


 English (US) ·