
The price of Bitcoin (BTC) in 2022 fell from 5.32 million yen to 2.17 million yen in one year, and the bearish trend became clear. In the foreign exchange market, the dollar-yen exchange rate rose to 150 yen to 1 dollar at one point. The rapid rise in interest rates by central banks around the world has slowed the inflow of funds into Bitcoin, which has led to a significant drop in the price of Bitcoin. Many central banks are expected to raise interest rates in the first half of this year, which is expected to be a headwind for the Bitcoin market.
Let’s take a look at Bitcoin’s December 2022 and January 1st week of 2023.
Bitcoin weekly
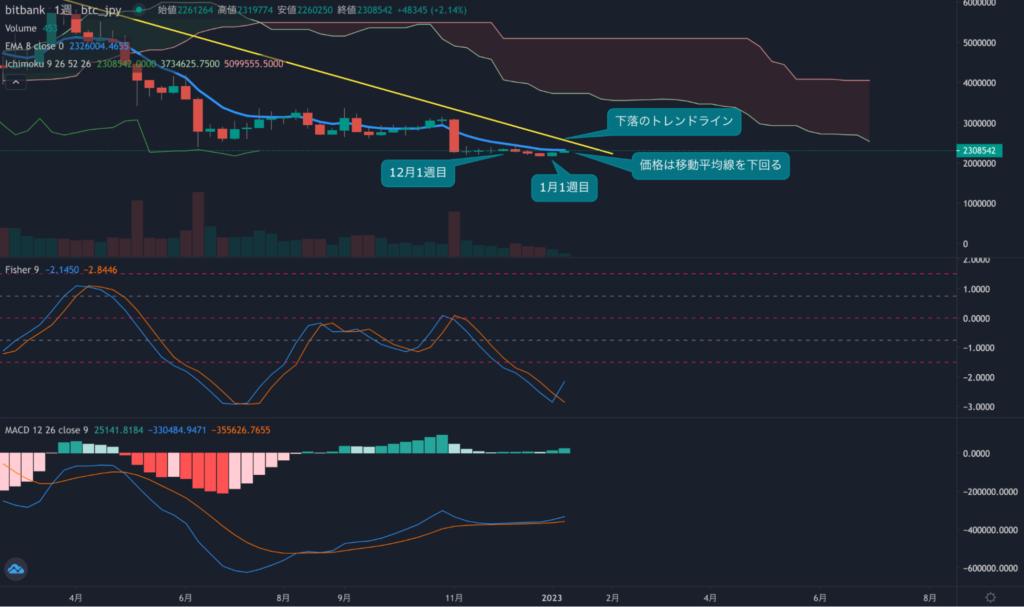
- The December weekly chart rose 1.4% in the first week and recorded 2.34 million yen, but the price fell for the next three weeks as negative lines continued. The closing price for the last week of December was 2.17 million yen, which is the final trading price for 2022.
- 2022 has finally failed to cross the downtrend line drawn from the 2021 high. It represents a continuous decline in prices throughout the year.
- In 2023, the price remained steady, rising 3.7% in the first week and recovering to 2.26 million yen. This week, the second week in a row, is also up 2.0% so far, increasing the possibility of recording two consecutive weeks of positive rays. On the other hand, the weekly chart is below the moving average line (8EMA) for about two months. Buying is leading in the current market, but in the long term, it is still a bearish trend and the market is in an adjustment market.
Bitcoin Weekly/Oscillator Indicators
 Bitcoin Weekly / bitbank
- Fisher, a short-term oscillator indicator, has been above the lagging line since this week and a golden cross has occurred. It shows that the downward momentum that has continued since November last year is beginning to reverse.
- The MACD of the long-term oscillator has moved above the lagging line. Weekly Oscillators are rising in both the short and long term, but are still in negative territory. It shows a recovery of momentum, but suggests a long correction period is still needed to enter an uptrend.
Next, let’s take a look at the trend of the Bitcoin futures market.
Bitcoin Futures Trading Price Divergence Rate
 Create bitbank from glassnode
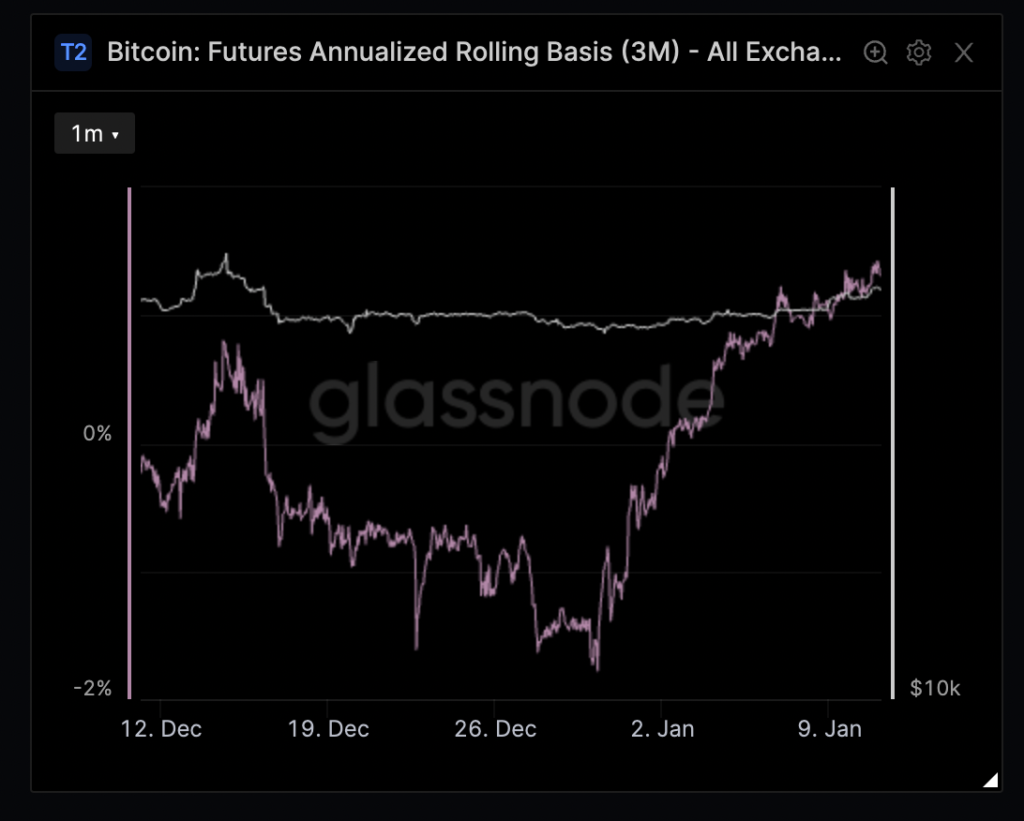
- The divergence rate between the three-month futures price of Bitcoin and the spot price has been on an upward trend since the beginning of the year. Until December last year, there were many bears in the market, and the divergence rate was negative. On December 30th, it temporarily fell to -1.6%. On the other hand, as the price rises after the new year, the deviation rate also rises and is currently around 1.3%, recovering into positive territory. Gradually speculators trading in the derivatives market appear to be buying.
- Speculative purchases indicate a change in market momentum, but spot prices do not yet show a strong uptrend, and speculators may have overestimated the market. . Excessive advance buying in the futures market can also cause the market price to rise, so caution is required.
Masayuki Sanada: Bitbank Market Analyst — Majored in economics at California State University and is interested in the flow of money in society. She became interested in bitcoin when she was in college, and while doing research on the industry at bitbank, she contributes to the company’s media. She gradually started investing and trading in Bitcoin from around the winter of 2015. Recently, she trades while analyzing derivative information and on-chain information in addition to basic technicals.
|Editing and composition: Takayuki Masuda
| Top image: Shutterstock.com
The post Market momentum has improved since the new year, speculators are buying in the futures market[bitbank chart analysis] appeared first on Our Bitcoin News.

 2 years ago
142





 English (US) ·