
The post PEPE Price Analysis: Back At Base Support, Is PEPE Ready For A Bounceback? appeared first on Coinpedia Fintech News
The PEPE coin price falls by 3.83% in the last 24 hours as it gets closer to the psychological mark of $0.0000010. The falling trend forms a bearish channel in the 4-hour chart and accounts for a drastic 34% drop over the last 24 days.
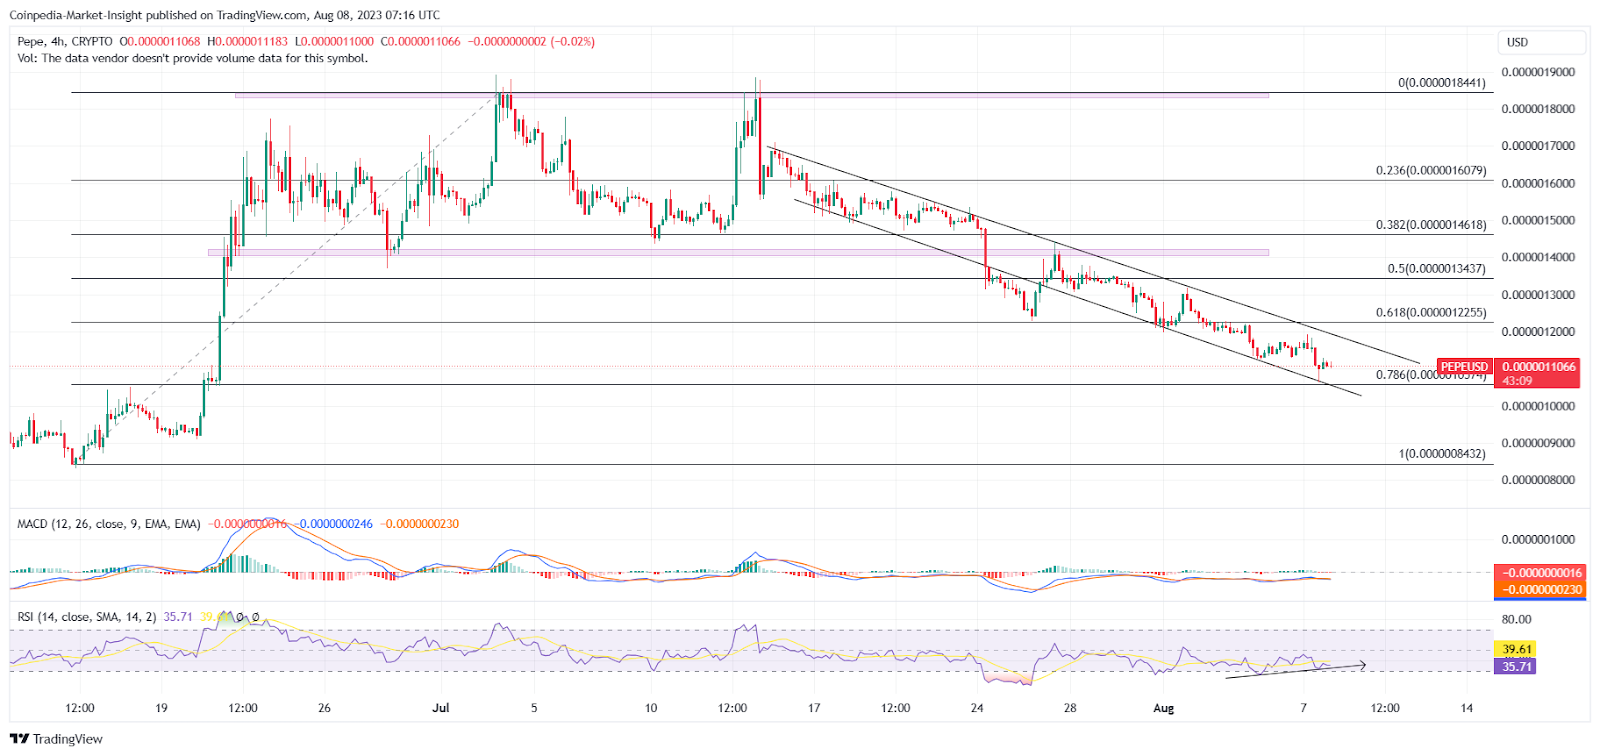
PEPE prices continue to break multiple Fibonacci levels and reach the crucial 78.60% Fib level at the psychological mark of $0.0000010. Currently, the price action displays a negative cycle taking lower price rejection from the support trendline.
However, the PEPE coin price is down by 4.75% in the last 24 hours, projecting a strong supply inflow. The bullish reversal within the channel faces strong opposition as the PEPE price struggles to float above $0.0000011.
The RSI indicator shows a notable bullish divergence in the 4-hour chart as the RSI line grows despite the PEPE price fall. This increases the likelihood of a bullish reversal to challenge the overhead resistance trendline.
The MACD indicator fails to showcase bullish reversal signals, projecting a further downtrend.
Optimistically, the channel breakout rally will exceed the 61.80% Fibonacci level to challenge the overhead supply pressure at $0.0000013437. In short, the channel breakout will bring a 20% jump opportunity for PEPE investors.
On the flip side, a further decline in the meme coins market value can break down the 78.60% Fibonacci level. The breakdown can drop the prices by 20% to test the bullish dominance at $0.0000008432.


 English (US) ·