
The post PEPE Price Analysis: With PEPE Coin Price Crashing This Week, Is A Reversal On The Charts? appeared first on Coinpedia Fintech News
Despite 78% of holders in the red, PEPE becomes a highly affected meme coin in the bear market. With the recent correction, the PEPE prices undermine the bullish dominance at the demand block of $0.000001050 with a head and shoulder breakout.
With the reversal from 50 EMA in the 4H chart, the PEPE prices nosedive 22% within 24 hours to reach the $0.0000008432 mark.
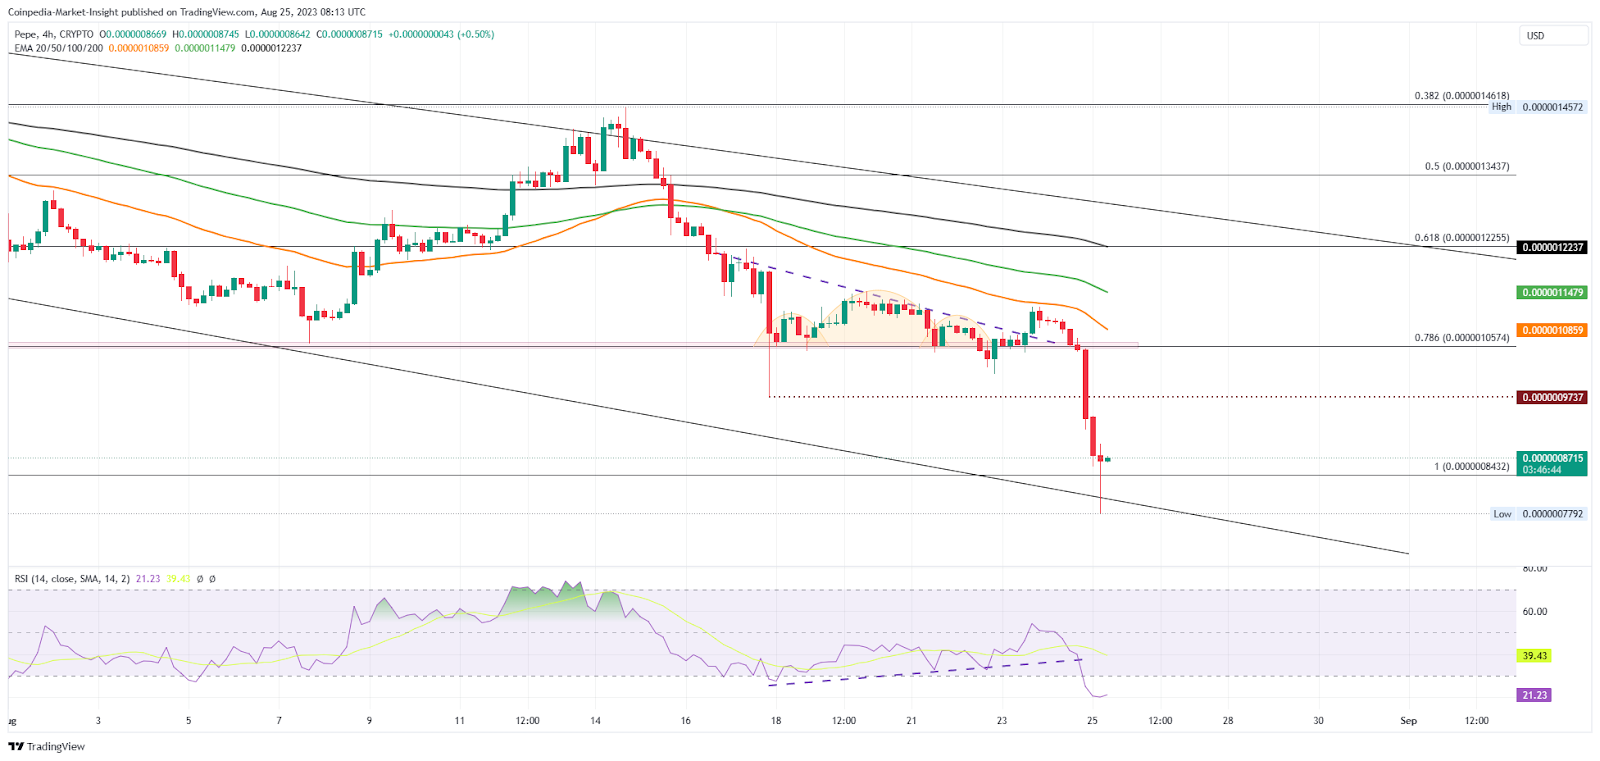
The sharp fall in the PEPE price breaks the psychological mark of $0.0000010, reaches $0.0000008432, and displays lower price rejection. Currently, PEPE is trading at $0.0000008672 with an intraday loss of 6.93%.
Moreover, the RSI indicator drops back into the oversold zone despite the bullish divergence displayed at $0.0000010.
Will PEPE Find A Reversal Chance?
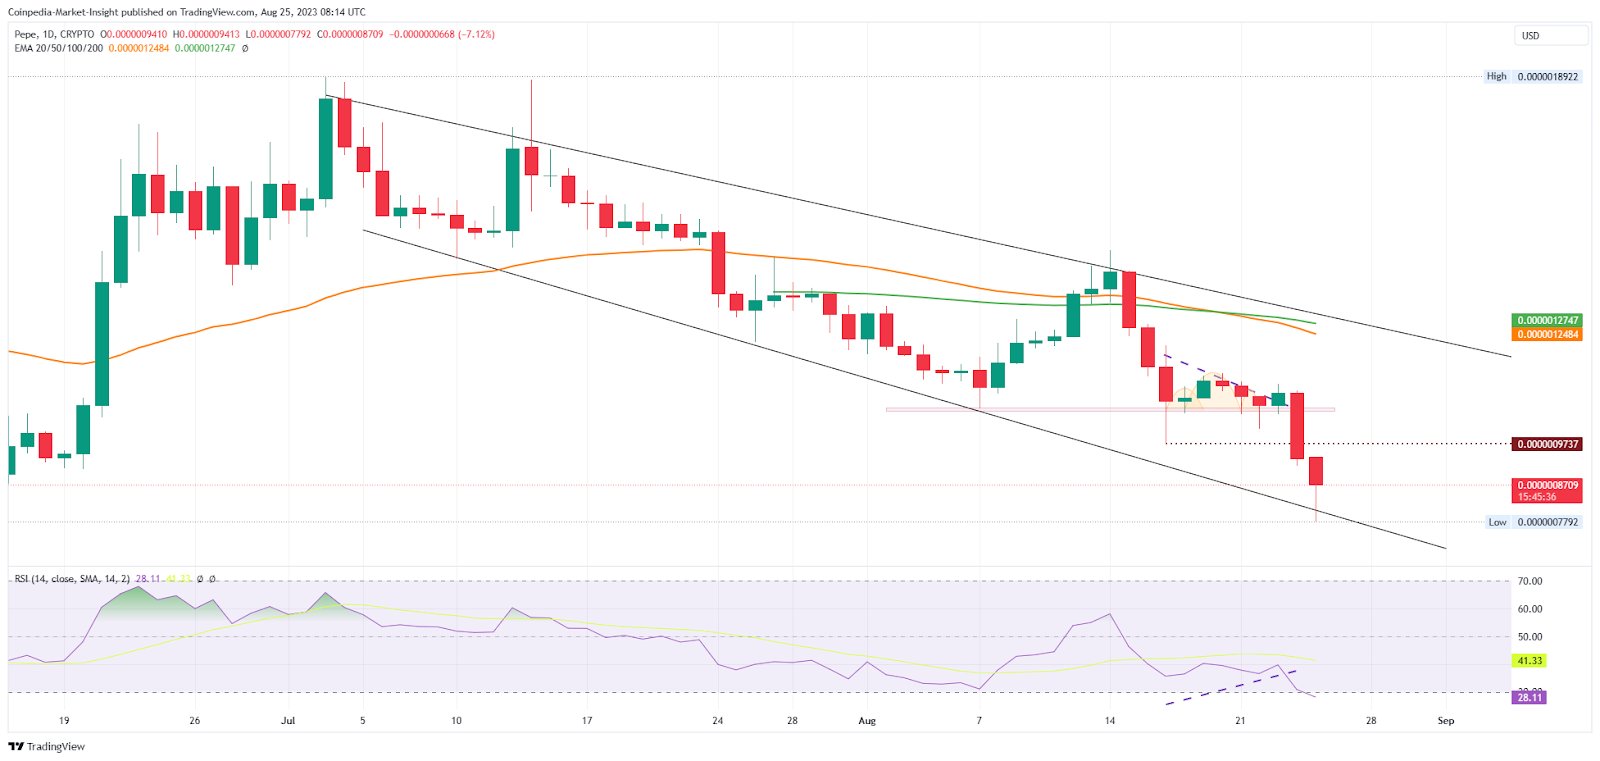
With the correction rally gaining momentum, the PEPE coin price action forms a falling wedge pattern in the 1-day chart. The bearish pattern accounts for a 52% drop in 52 days as PEPE completes its fourth negative cycle.
The lower price rejection in the daily candle reflects some buying pressure at the support trendline. However, the intense rise in selling pressure during the bear market lowers the chances of a bullish recovery.
Nevertheless, the PEPE may find some sideways trend before the market recovers.
Therefore, the PEPE price may continue a sideways trend between $0.0000008432 and $0.0000010. On a bearish note, a downfall below the support trendline will crash the meme coin to $0.0000006721.


 English (US) ·