The post Polkadot and Fantom Lead Altcoin Rally: Will October Rally Push DOT and FTM Higher? appeared first on Coinpedia Fintech News
As the altcoin market makes a comeback, with Bitcoin momentarily crossing above the $66,000 level, Polkadot and Fantom are gaining momentum. FTM and DOT are ranking among the top performers with a breakout and a trend reversal rally.
Will this bullish trend in Fantom and Polkadot continue in this October rally? Let’s find out as they become the top altcoin picks to buy this week.
Top Performing Altcoin Tokens To Buy:
Fantom (FTM)
With a market cap of $2.185 billion, Fantom has increased by 12.46% in the past 24 hours. Currently, the altcoin is trading at $0.7794, with a 13.20% surge in the past seven days.

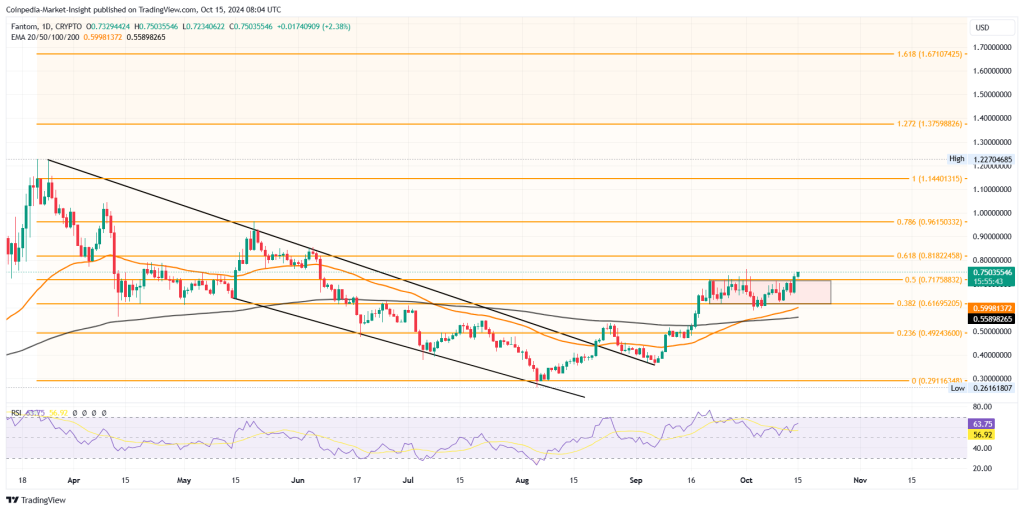
In the daily chart, Fantom’s falling channel breakout rally faced a consolidation phase between $0.61 and $0.71. However, the recent surge in bullish momentum leads to a consolidation range breakout surpassing the 50% Fibonacci level.
Furthermore, the growing bullish influence has led to a golden crossroad between the 50-day and 200-day EMA. Even the daily RSI line is sustaining a healthy trend above the 50% line and is approaching the overbought boundary.
Based on the Fibonacci level, the breakout rally will likely challenge the 78.60% Fibonacci level at $0.96 before reclaiming the $1.01 psychological mark. By the month’s end, the altcoin will likely hit the $1.14 mark.
Will the altcoins surge this October? Find out now in Fantom price prediction for 2024 to 2030.
Polkadot (DOT)
With a market cap of $6.68 billion, Polkadot is currently trading at $4.44. In the past 24 hours, the altcoin has surged by 4.30%, resulting in a 7-day surge of 7.65%.

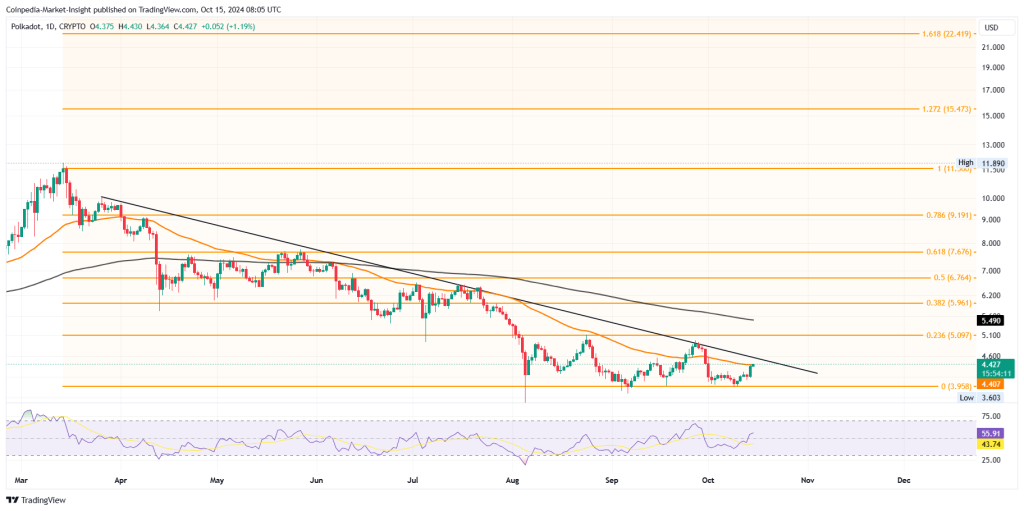
In the daily chart, the DOT price action showcases a struggle for a bullish comeback for the $3.958 support level. With multiple bounce-backs from this crucial level, the daily RSI line reveals a massive bullish divergence.
Currently, the bullish cycle challenge is heading for a closure above the 50-day EMA to challenge the resistance trendline. Based on the Fibonacci level, the altcoin is likely to challenge the $5 psychological mark near the 23.60% Fibonacci level.
Beyond this, the dynamic resistance of the 200-day EMA at $5.491 remains a secondary target. By the end of the month, if the bullish trend sustains, the altcoin fueled by the trend line breakout, is likely to hit the 50% Fibonacci level at $6.76.

 1 month ago
24


 English (US) ·