 2 years ago
145
2 years ago
145

A technical analysis indicator called Bollinger Bands suggests an explosion in Bitcoin (BTC) volatility, grabbing the attention of cryptocurrency traders and analysts ahead of US inflation report in June. Collecting.
“The Bollinger Bands are tight. Squeeze like this has rarely happened in the last decade. on July 12thtweeted.
Bitcoin’s Bollinger Bands So-called Squeeze or Tighten is the creator of this indicatorIt even caught the eye of John Bollinger..
Bollinger Bands are derived by placing volatility lines two standard deviations above and below the asset price’s 20-day simple moving average (SMA). The bands fluctuate according to the degree of price volatility, with narrowing and tightening of the bands representing a contraction of volatility, and widening of the bands representing an explosion of volatility.
A sharp tightening of the band prepares traders for a big move, after which the price usually trades above the band. The theory is that during consolidation markets accumulate energy that is eventually released in one direction or another.
The most common way to track bandwidth is to divide the spread between the upper and lower bands by the price’s 20-day SMA.
According to charting platform TradingView, Bitcoin’s Bollinger bandwidth has dropped to 0.04, its lowest level since early January.
Anonymous Analyst’sNunya BiznizRarely has bandwidth been this low in Bitcoin’s 14-year history, and we may see a volatility explosion soon, he said.
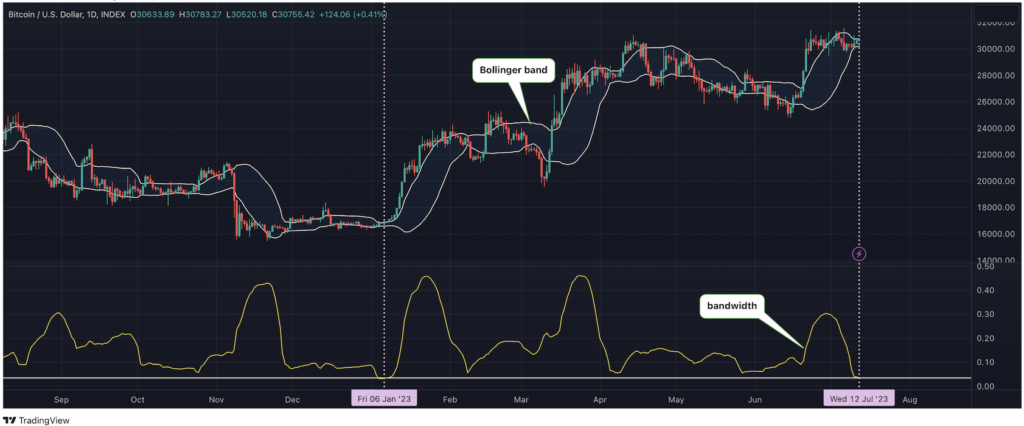 The width of the Bollinger Bands is at its narrowest since early January. (TradingView)
Bandwidth tightening does not necessarily mean an immediate and noticeable burst of market volatility or a clearer direction of price movements.
Nonetheless, the US Consumer Price Index (CPI) scheduled for release at 12:30 UTC on the 12th (9:30 pm Japan time) It is likely to affect interest rate expectations and create market volatility.
U.S. consumer price index (CPI) fell to 3.1% in June from 4.0% in May, while the core slowed to 5% from 5.3%, according to a Wall Street Journal economist survey. is expected to.
At 3.1%, it would be closer to the Fed’s target of 2% and less likely to continue raising interest rates and tightening monetary policy, which contributed to last year’s cryptocurrency crash. In other words, Bitcoin could break out of the Bollinger Bands squeeze if inflation data matches expectations.
According to a report released on the 11th, used car prices, one of the main components of the US CPI, fell 10.3% over the past year, and in June they recorded a 10-month decline.
As such, risky assets, including Bitcoin, could face downside movements if headline and core CPIs end up above expectations. According to CoinDesk data, bitcoin prices are flat at around $30,630 at the time of writing.
|Translation: CoinDesk JAPAN
|Editing: Toshihiko Inoue
|Image: TradingView
|Original: Crypto Traders Prepare for Bitcoin Volatility as Focus Shifts to US CPI
The post Signs of volatility surge on BTC chart ── before US CPI announcement | CoinDesk JAPAN | Coin Desk Japan appeared first on Our Bitcoin News.


 English (US) ·