
In this article, the Bitcoin market is analyzed in 5 stages (5 → 1: Strong → Weak) using six representative technical analyzes: pattern analysis, moving average (9MA, 25MA), Ichimoku Kinko Hyo, Bollinger Bands, MACD, and RSI. Evaluate the strength of the market with the average.
I believe that fixed-point observation and objectivity are important in technical analysis. The aim is to eliminate arbitrariness and improve accuracy by combining multiple representative analysis methods.
*This article is a reprint of the technical report of “Rakuten Wallet”.
summary
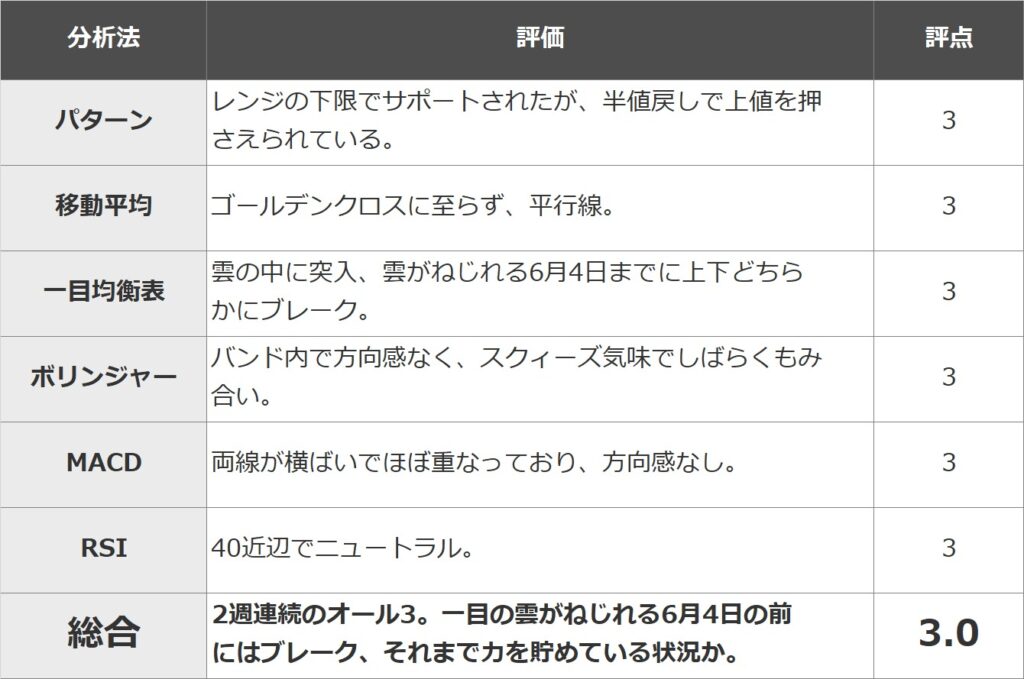
All 3 for 2 weeks in a row. I have the impression that the sense of direction has faded even more since last week, but the Ichimoku’s cloud will twist on June 4th, so it is likely that there will be a move from the second half of next week to the end of the week. Conversely, there remains a chance of range trading until the first half of next week.
If the current range is broken, the target will be 4.1 million yen for the top and 3.4 million yen for the bottom.
pattern analysis
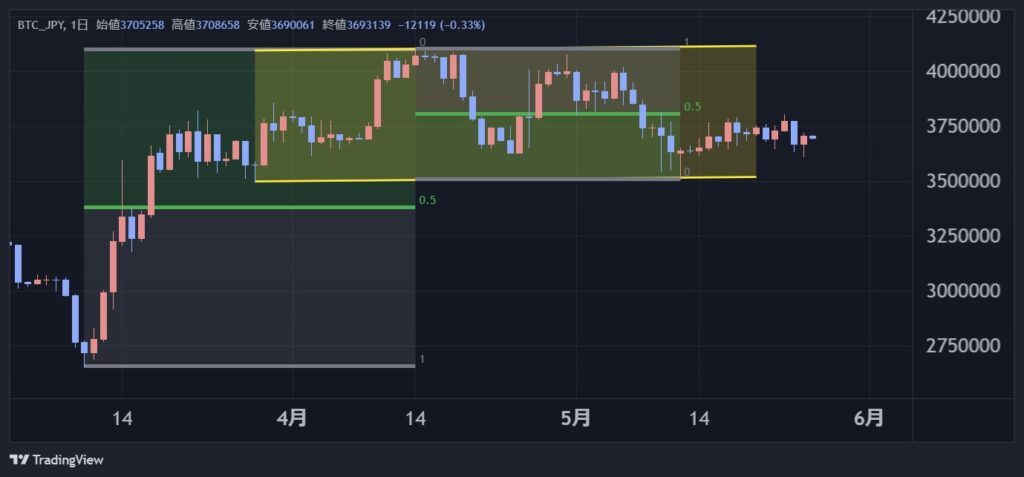
Similar to last time, the lower half of the parallel channel supported the pair and the upper half was capped by a half-price return, resulting in a struggle in the lower half of the range. In the event of a break above or below, support will be provided at half-price 3.4 million yen below, and resistance will be near the upper limit of 4.1 million yen in the parallel channel.
Rating: 3
moving average
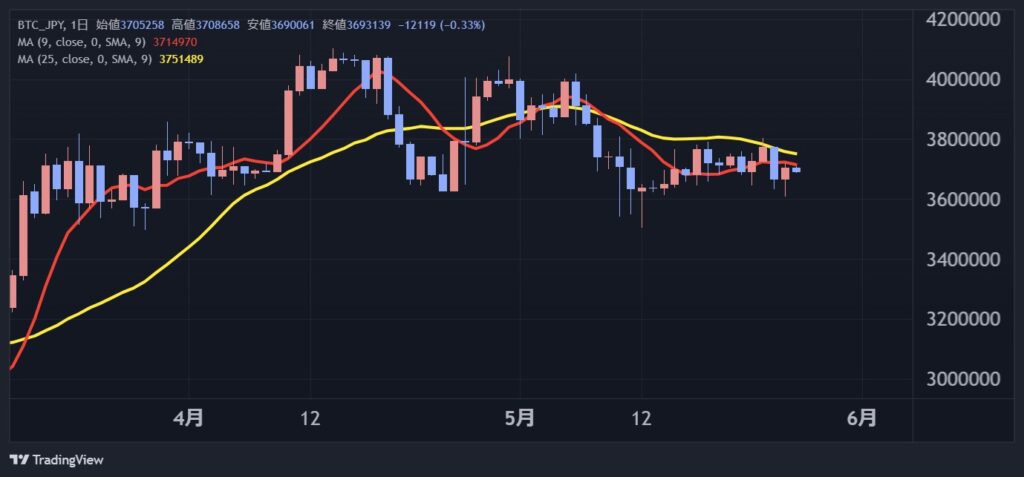

After the dead cross on May 9, the divergence between the two moving averages narrowed, but did not reach the golden cross, and both lines are parallel.
Rating: 3
Ichimoku Kinko Hyo
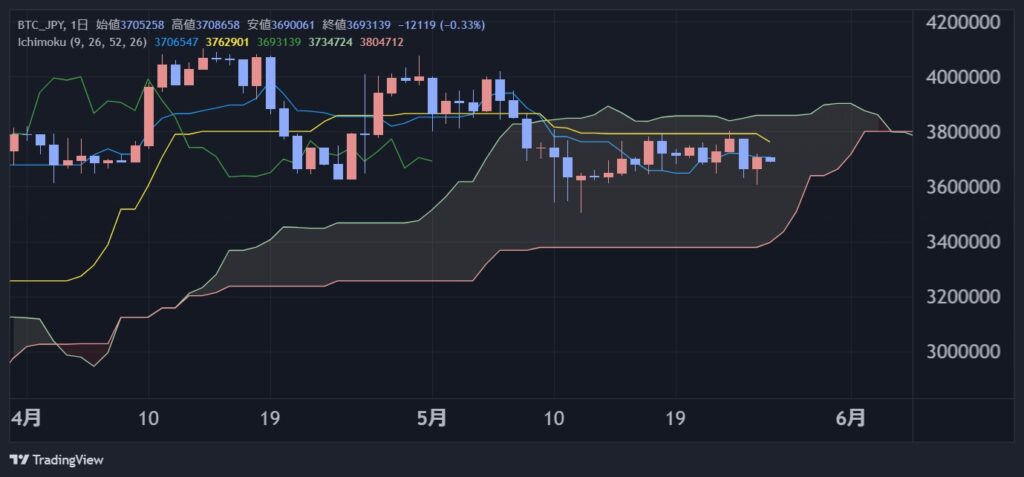

After entering the cloud, the upper price was held down by the upper limit of the cloud and remained flat. From the middle of next week, the width of the cloud will shrink, and by June 4, when the cloud will twist, it will pass either up or down. If it breaks down, there is a possibility that a sell signal will come out, reversing the three roles.
Rating: 3
bollinger bands
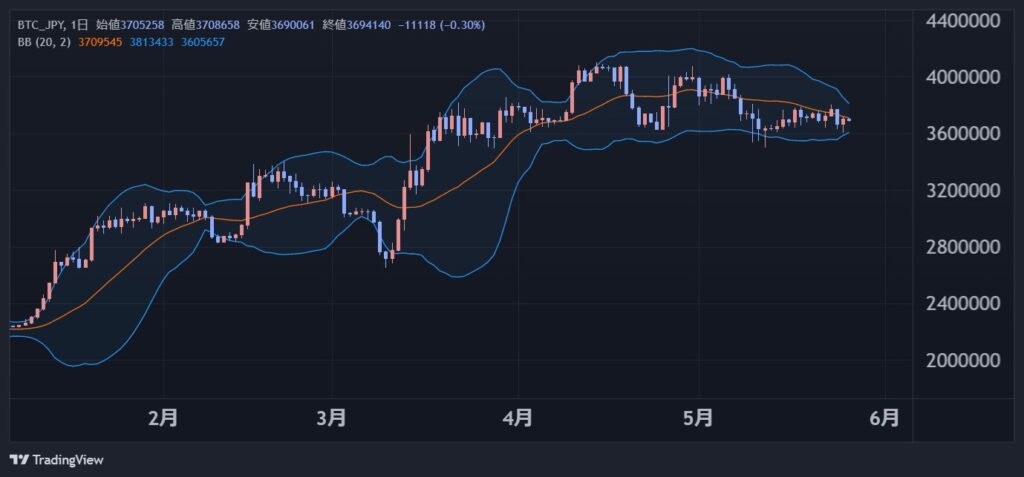

The band is also flat and has no sense of direction, and the band is squeezing and suggesting continuation.
Rating: 3
MACD
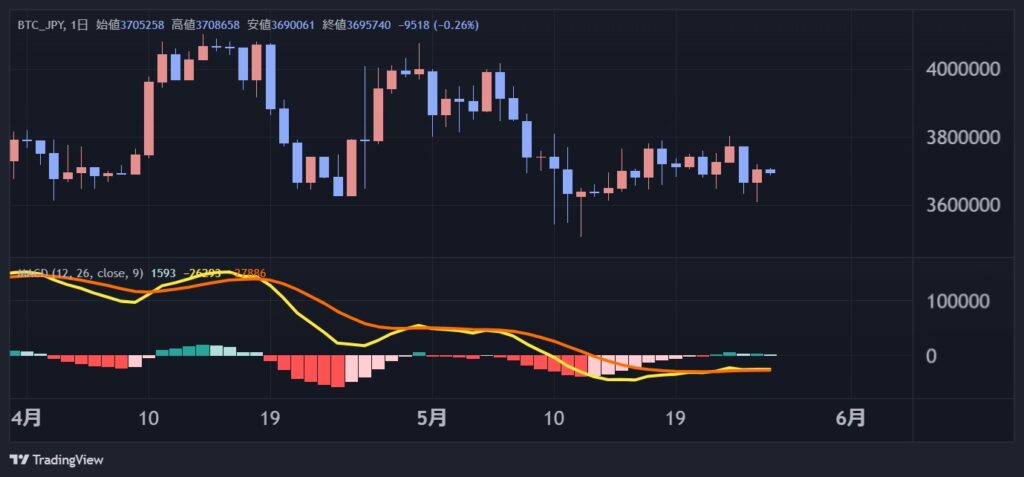

Both MACD and signals are flat and almost overlapping, so there is no sense of direction at all.
Rating: 3
RSI
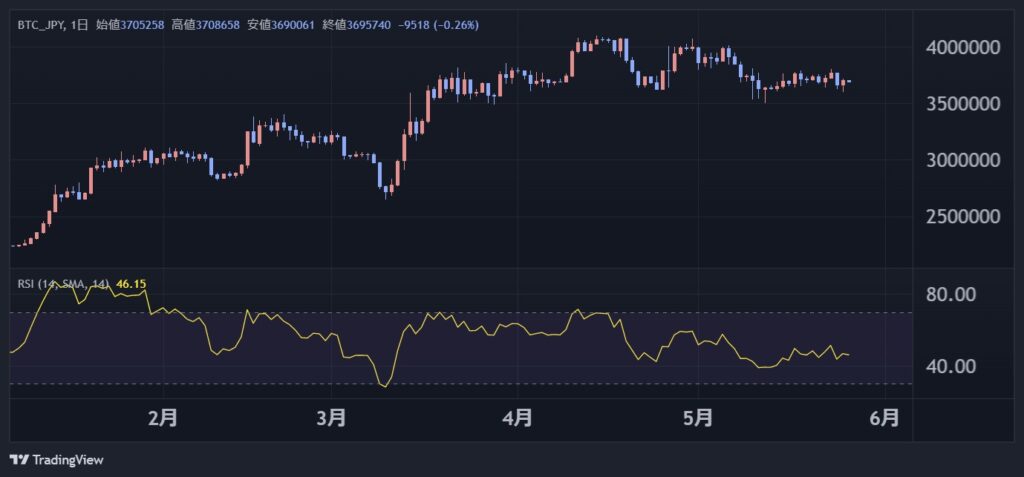

No sense of direction around 40.
Rating: 3
grade

Yasuo Matsuda
Rakuten Wallet Senior Analyst
Majored in the international monetary system at the Faculty of Economics, University of Tokyo. He is engaged in foreign exchange and bond sales and trading at Mitsubishi UFJ Bank and Deutsche Bank Group. Since 2018, she has been engaged in analysis and forecasting of the crypto-asset market at a crypto-asset exchange service, and is forecasting a peak of 8 million yen in 2021 and 5 million yen at the end of the year, which is almost right. Current position from January 2022.
*This article provides information for reference in making investment decisions, but is not intended to recommend stocks or solicit investment activities. In addition, Rakuten Wallet does not solicit investment or make definitive forecasts.
*Information sent may include future forecasts, but this is the opinion of the individual sender, and we do not guarantee its accuracy or reliability. Please make your own final investment decisions.
| Editing: coindesk JAPAN
|Image: Rakuten Wallet
|Reprinted from: Rakuten Wallet
The post Technical Analysis by Matrix Method (May 26, 2023) Bitcoin is finally approaching a range break: Rakuten Wallet | coindesk JAPAN | Coindesk Japan appeared first on Our Bitcoin News.

 2 years ago
80


 English (US) ·