
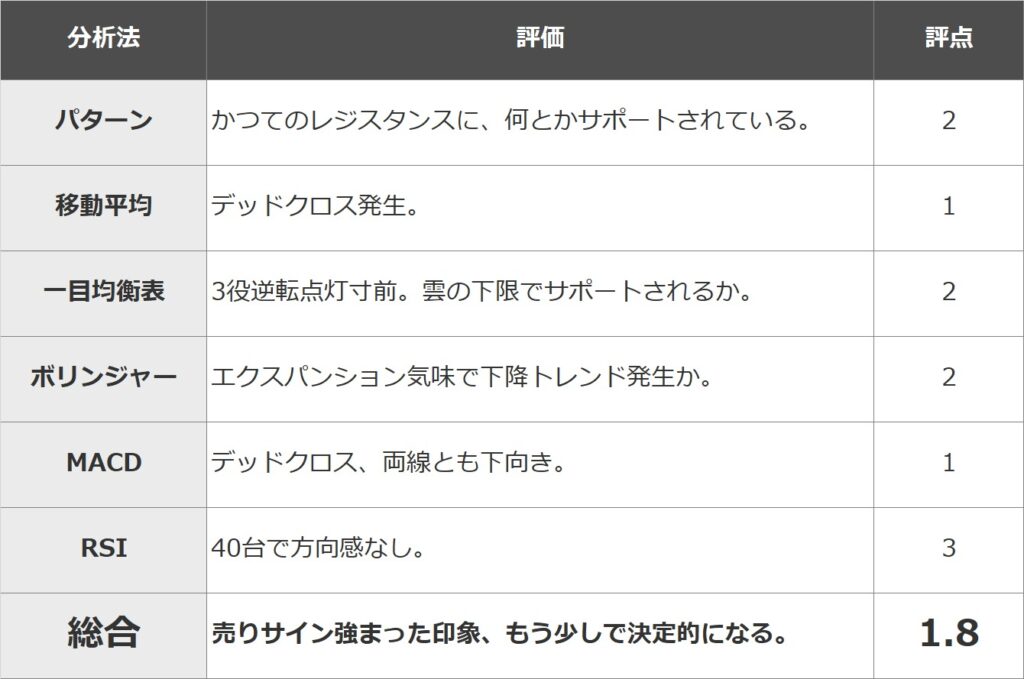
In this article, we will evaluate the Bitcoin market in 5 levels (5→1: strong→weak) using 1) pattern analysis, 2) moving average line (9MA, 25MA), 3) Ichimoku Kinko Hyo, 4) Bollinger bands, 5) MACD, and 6) RSI. , and evaluate the strength or weakness of the market based on the average.
I believe that fixed point observation and objectivity are important in technical analysis. The aim is to eliminate arbitrariness and increase accuracy by combining multiple representative analysis methods.
summary
The overall score was 1.8. Last time, I said that the price was 2.2 and that it was “not as bad as it looks” and that it was “likely to break out either above or below,” but in the end, it broke below and the sell signal became stronger. Currently, it is somehow supported by the upper limit of November’s range and the lower limit of Ichimoku’s cloud. In a sense, this can be said to be the last line of defense, and if the price breaks below, the sell signal will become even clearer, and there will be room for the price to fall to 5.4 million yen, the halved price, and 4.9 million yen, the 200-day moving average.
In addition, here we use the chart of BTCJPY from Rakuten Wallet’s margin exchange. Please refer to the BTCUSD chart here (link is to TradingView’s website).
pattern analysis
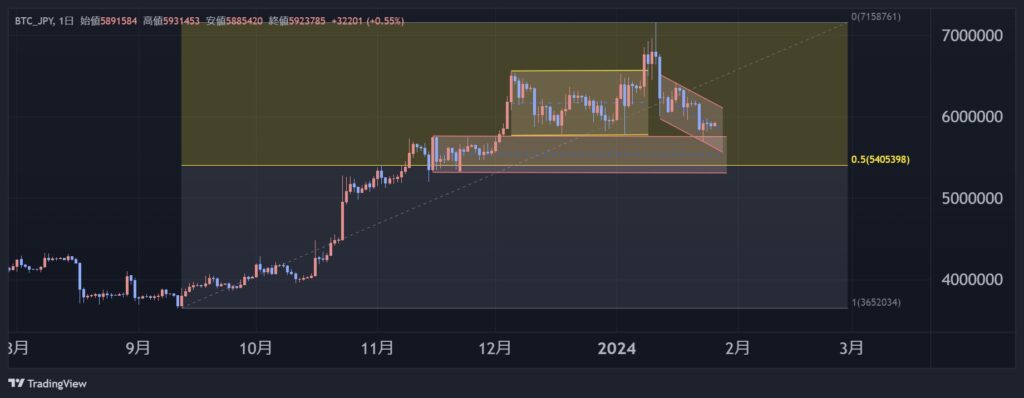

A new downward channel was formed and the price dropped to 5.7 million yen, but on a real basis it is supported at around 5.75 million yen, the upper limit of November’s turmoil and range. It wouldn’t be surprising if the decline stopped here, but it wouldn’t be surprising if the price drops to around 5.4 million yen, which would be the lower end of the November range or half the price increase from September.
Rating: 2
moving average line
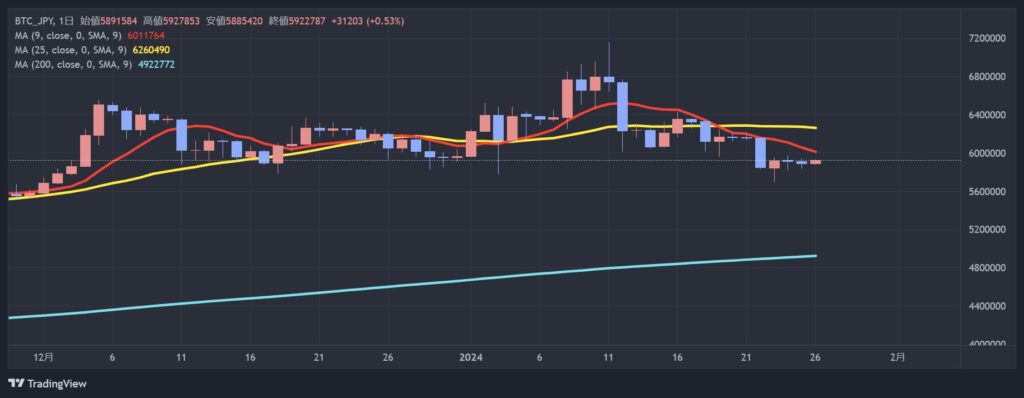

A dead cross has occurred, the 9MA is downward, and the 25MA is also turning downward. It would not be surprising if the 200MA is adjusted to around 4.9 million yen.
Rating: 1
Ichimoku Kinko Hyo
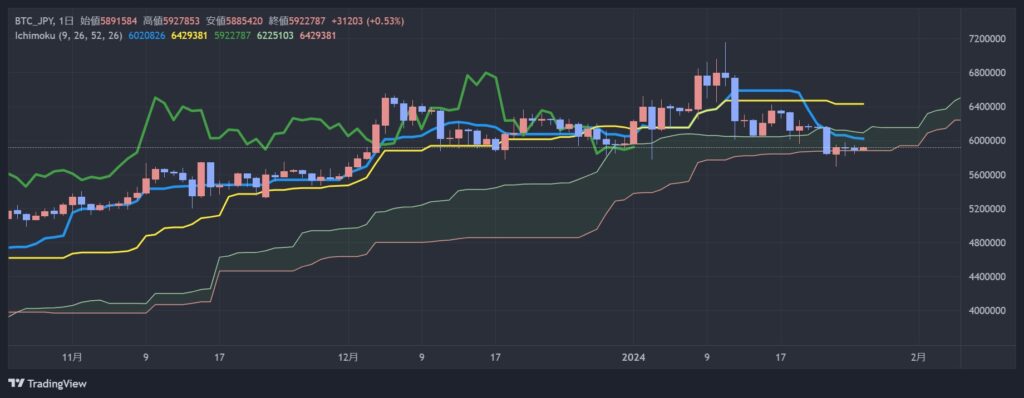

It temporarily fell below the lower limit of the cloud, but it is somehow supported on a physical basis. A clear break below will illuminate a strong sell signal with a three-way reversal.
Rating: 2
bollinger bands
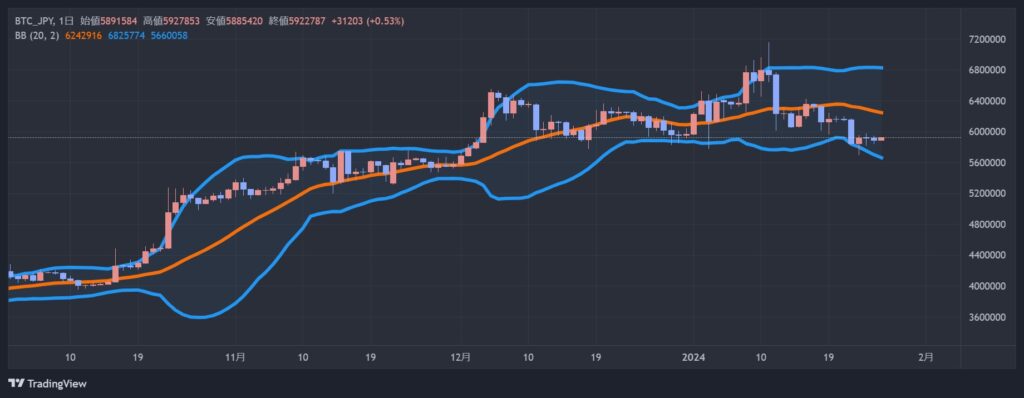

A new downtrend may have occurred with a touch of expansion at the lower limit of the band.
Rating: 2
MACD
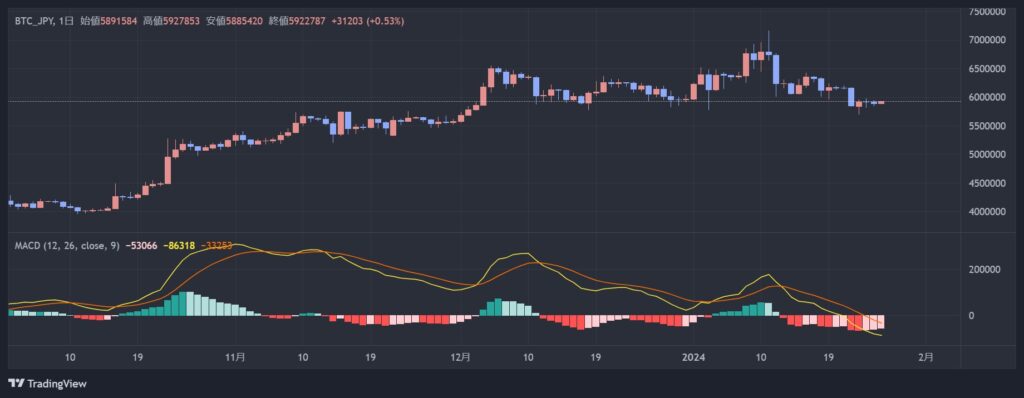

A dead cross has occurred, and both lines are pointing downwards.
Rating: 1
RSI
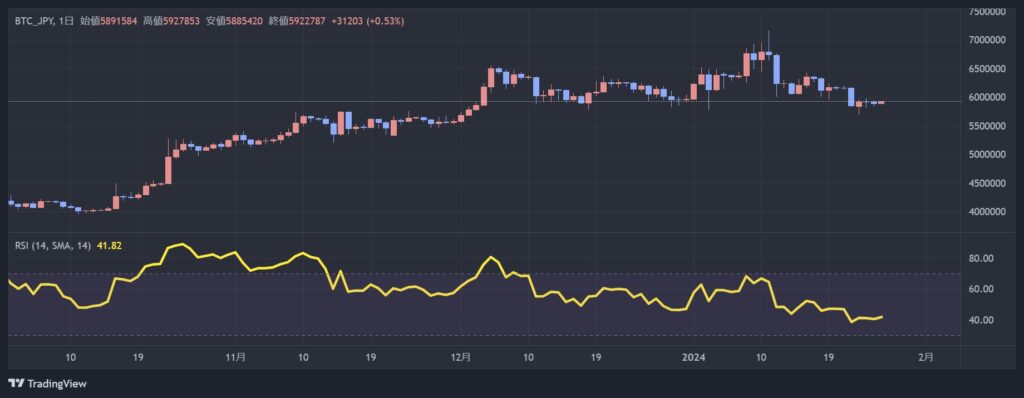

40 cars with no sense of direction.
Rating: 3
Rating

*This article is a reprint of the Rakuten Wallet technical report.
*This article provides information for reference when making investment decisions, but is not intended to recommend stocks or solicit investment activities. Furthermore, Rakuten Wallet does not solicit investments or make definitive predictions.
*The information posted may include future predictions, but it is the opinion of the individual sender, and its accuracy and reliability are not guaranteed. Please make your own final investment decisions.
|Edited by coindesk JAPAN
|Image: Rakuten Wallet
|Reprinted from: Rakuten Wallet
The post Technical analysis using the matrix method (2024/1/26) Bitcoin approaches the last line of defense: Rakuten Wallet | CoinDesk JAPAN appeared first on Our Bitcoin News.

 1 year ago
74



 English (US) ·