
In this article, we will evaluate the Bitcoin market in 5 stages (5 → 1: strong → weak) using 1) pattern analysis, 2) moving average line (9MA, 25MA), 3) Ichimoku Kinko Hyo, 4) Bollinger Bands, 5) MACD, and 6) RSI using six typical types of technical analysis. The strength and weakness of the market is then evaluated using the average.
I believe that fixed point observation and objectivity are important in technical analysis. The aim is to eliminate arbitrariness and increase accuracy by combining multiple representative analysis methods.
summary
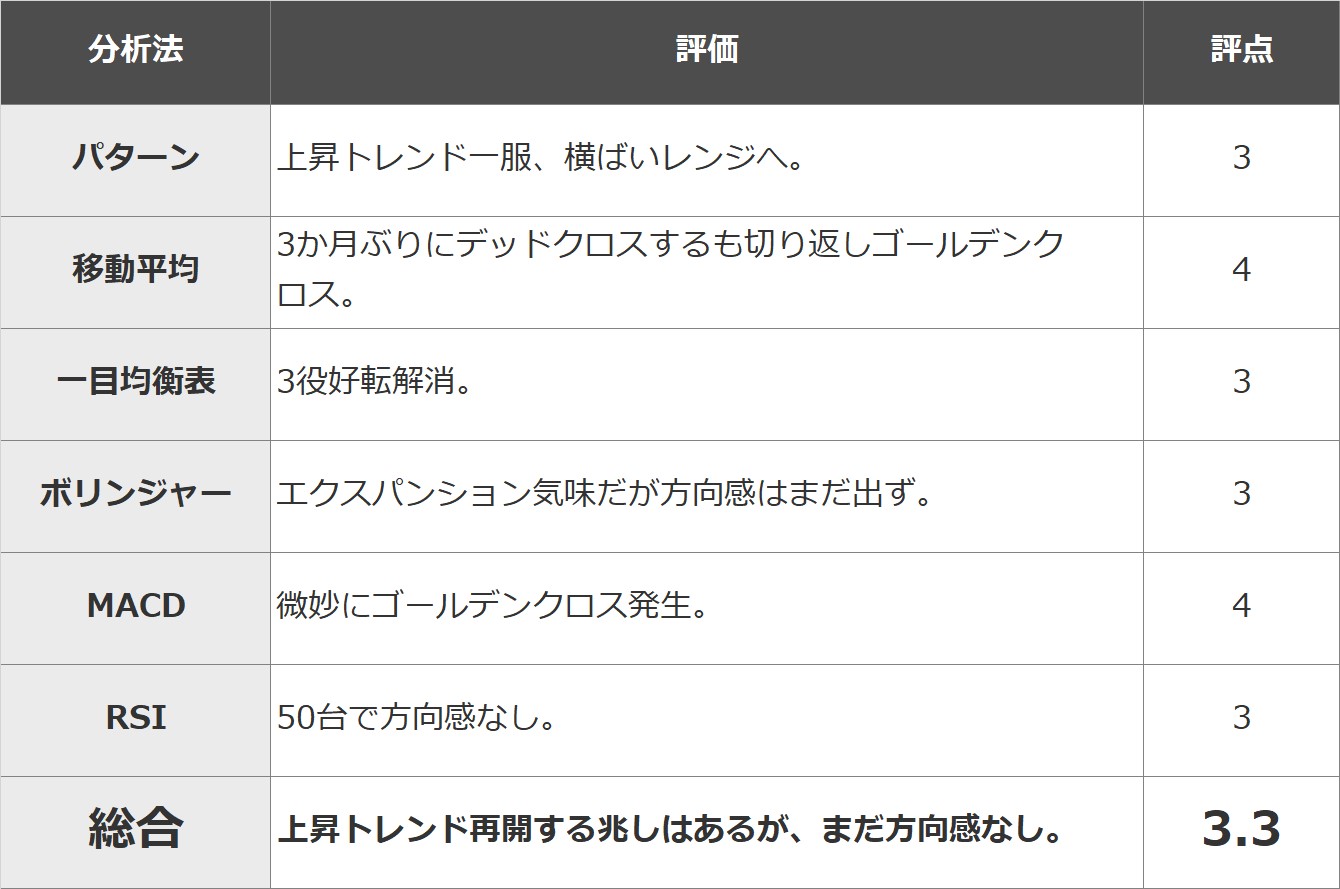
The overall score is 3.3. The uptrend has come to an end and the price has entered a flat range. There are some hints of a resumption of the uptrend, but we cannot be sure yet. The market appears to be trying to determine its direction ahead of the big news, whether or not spot ETFs will be approved.
In addition, here we use the chart of BTCJPY from Rakuten Wallet’s margin exchange. BTCUSD Please refer to the chart here (link is to TradingView’s website).
pattern analysis
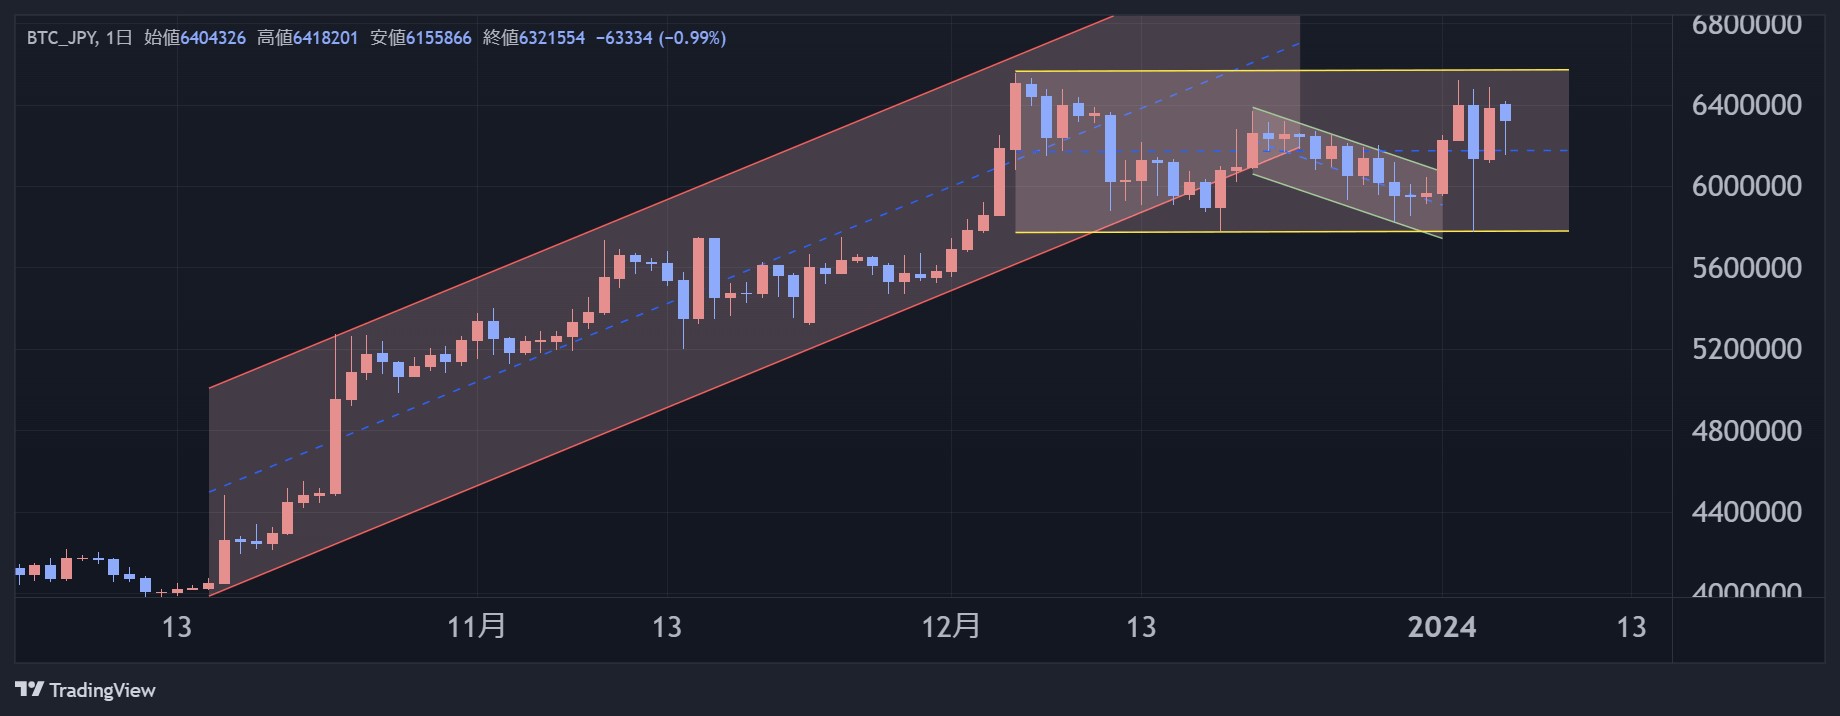

The trend has broken out of the upward trend that has continued since October. However, the price broke above the small rising flag and seemed to be restarting its uptrend, but in the end, the price was capped at the high of 6.55 million yen on December 5, and this time it reached the top of the November range and the low on December 18. Supported. As a result, a range of 5.75 million yen to 6.55 million yen was formed, and the trend shifted from an upward trend to a flat area.
Rating: 3
moving average line
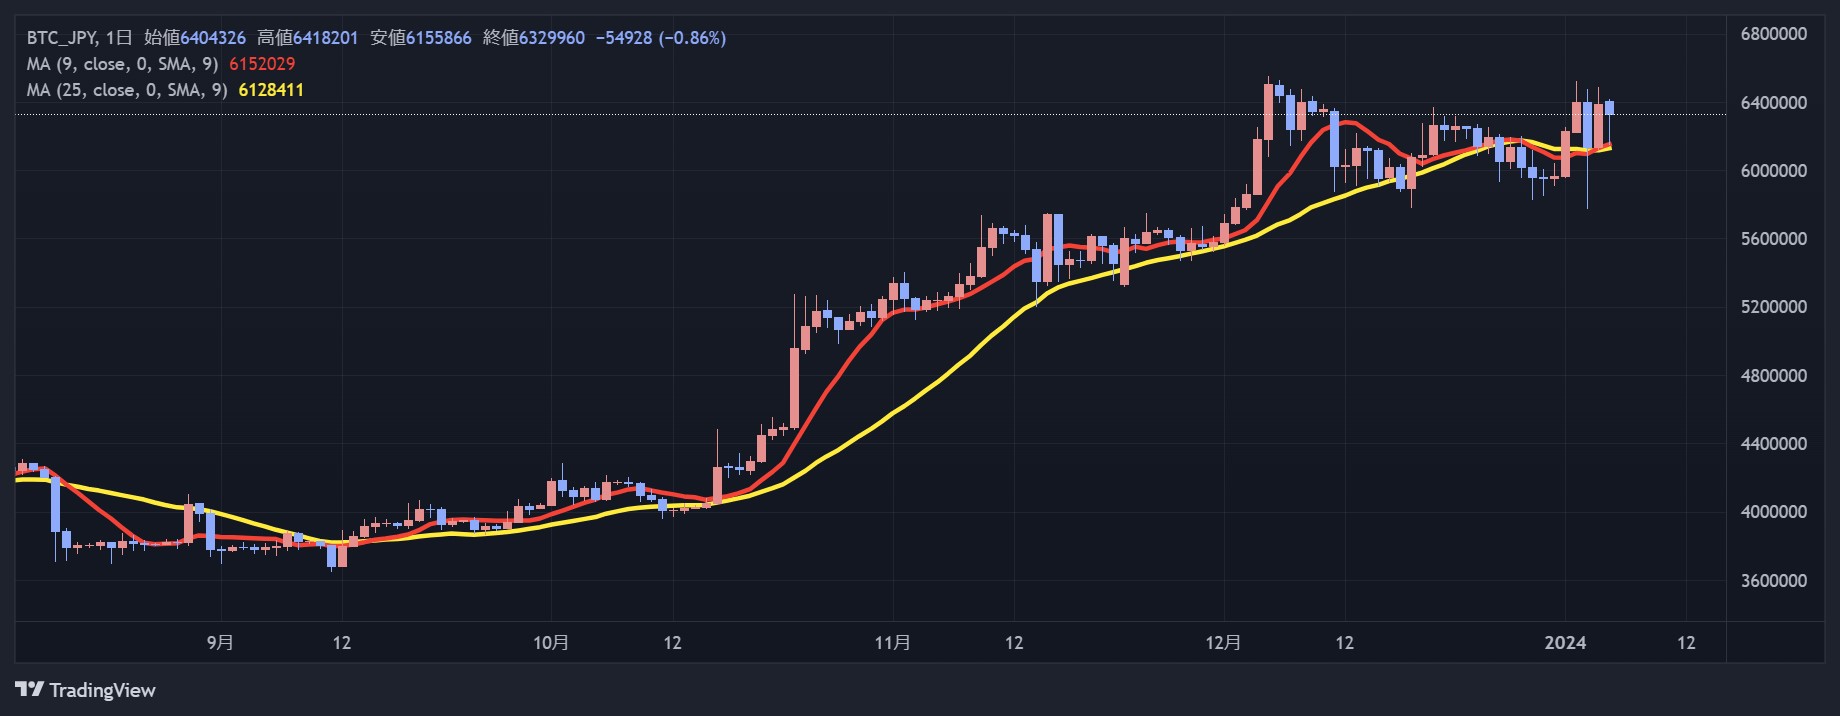

A dead cross was formed for the first time in three months since it became a golden cross in September last year, but it turned around and formed a golden cross at the beginning of the year. However, both lines are almost flat, so we cannot feel safe yet.
Rating: 4
Ichimoku Kinko Hyo
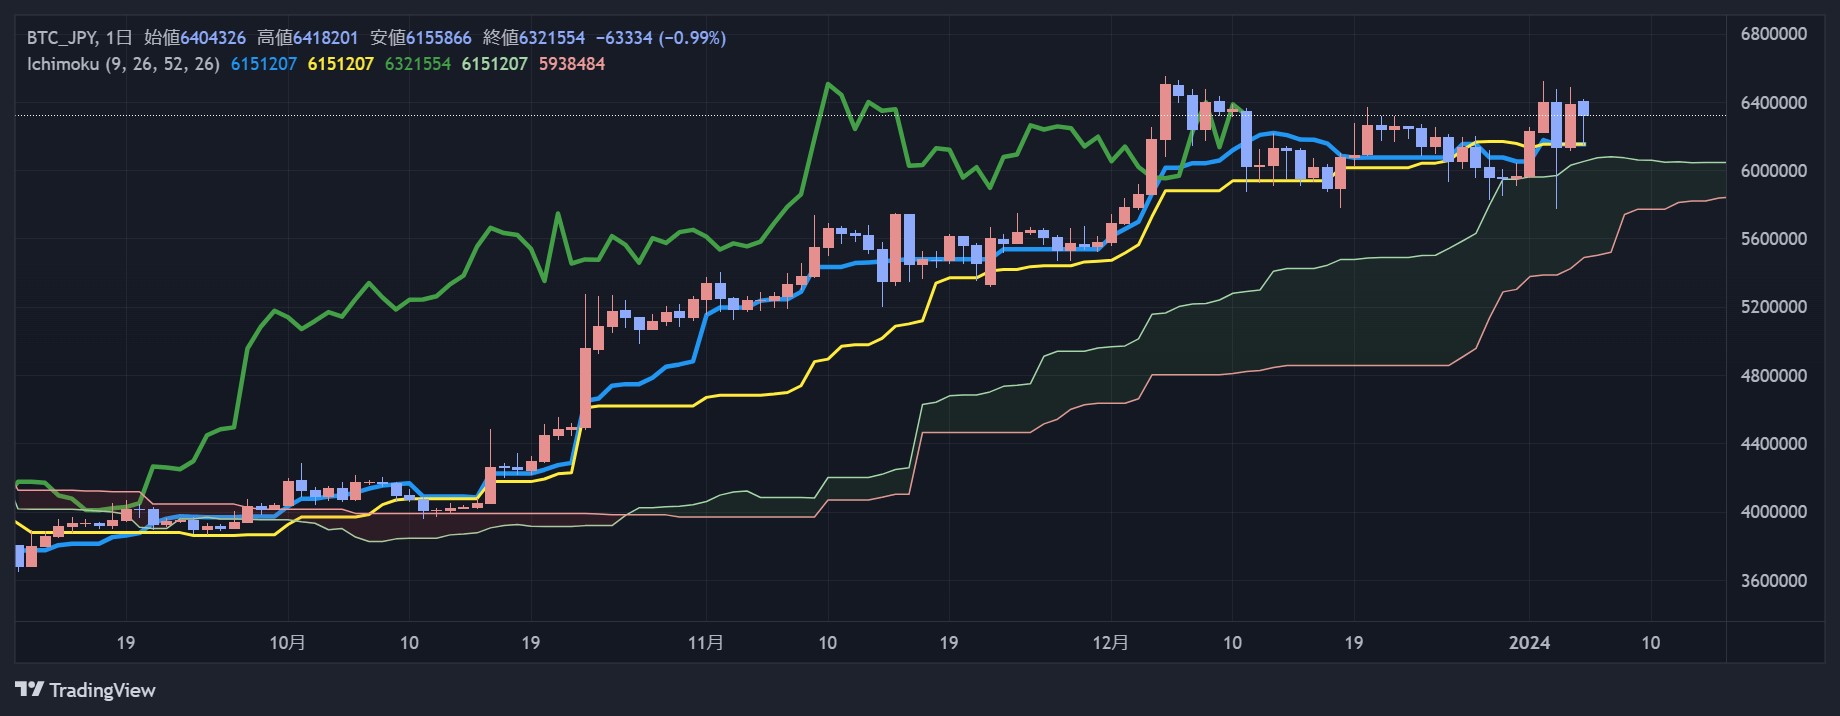

Here too, the three-position improvement since October last year has been resolved. In the lower part of the whisker, it is in the clouds. It remains to be seen whether he will somehow be supported by the upper limit of the cloud and the three-way turnaround will turn on again, or whether he will end up in the cloud.
Rating 3
bollinger bands
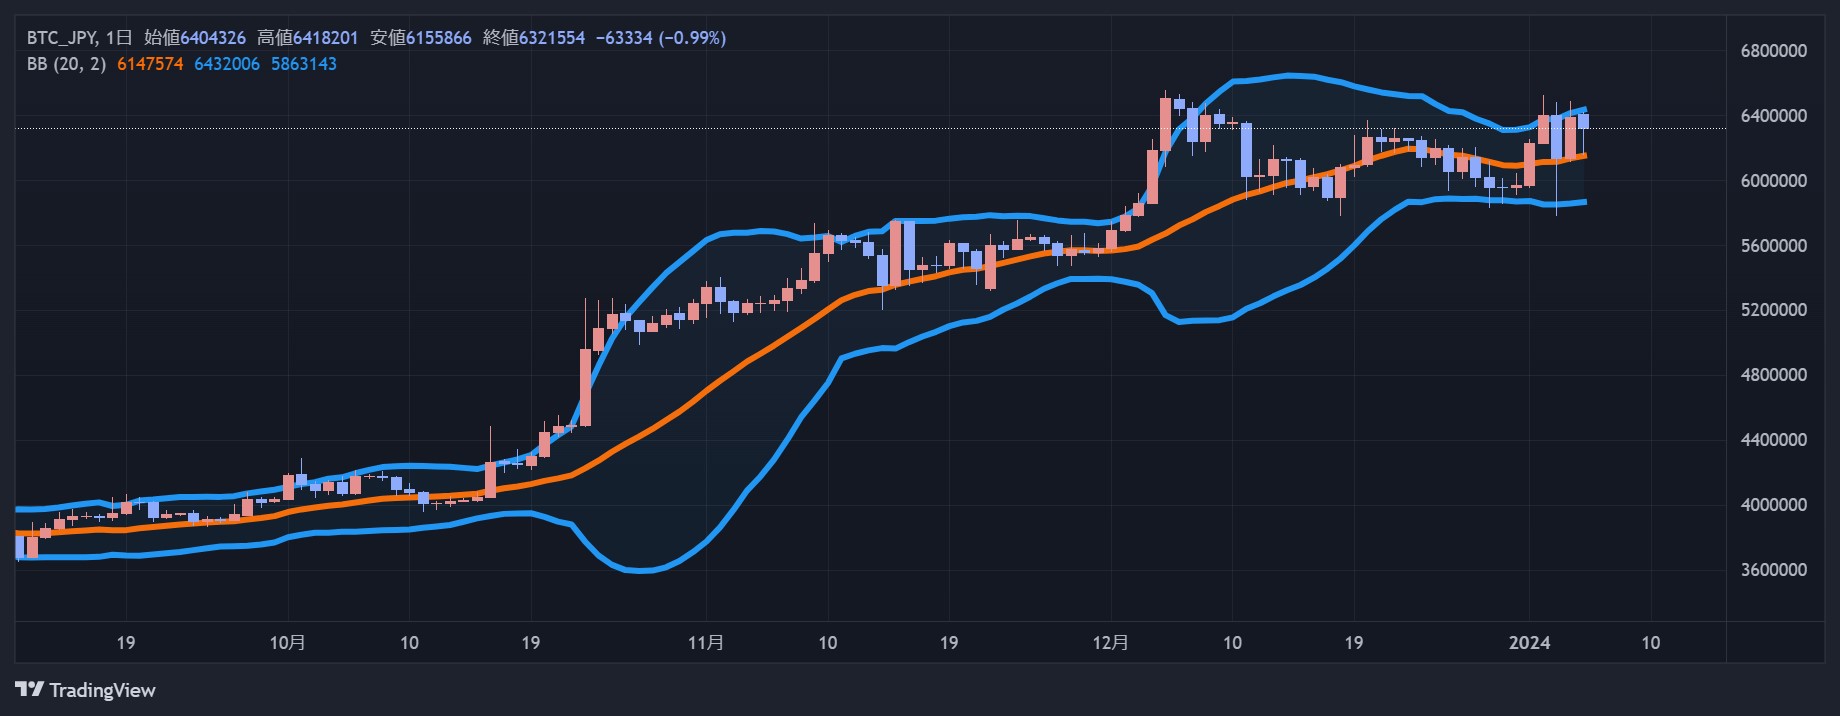

The band is Squeeze. Although there is no sense of direction, there is a possibility that a new trend will form once again with a hint of expansion.
Rating: 3
MACD
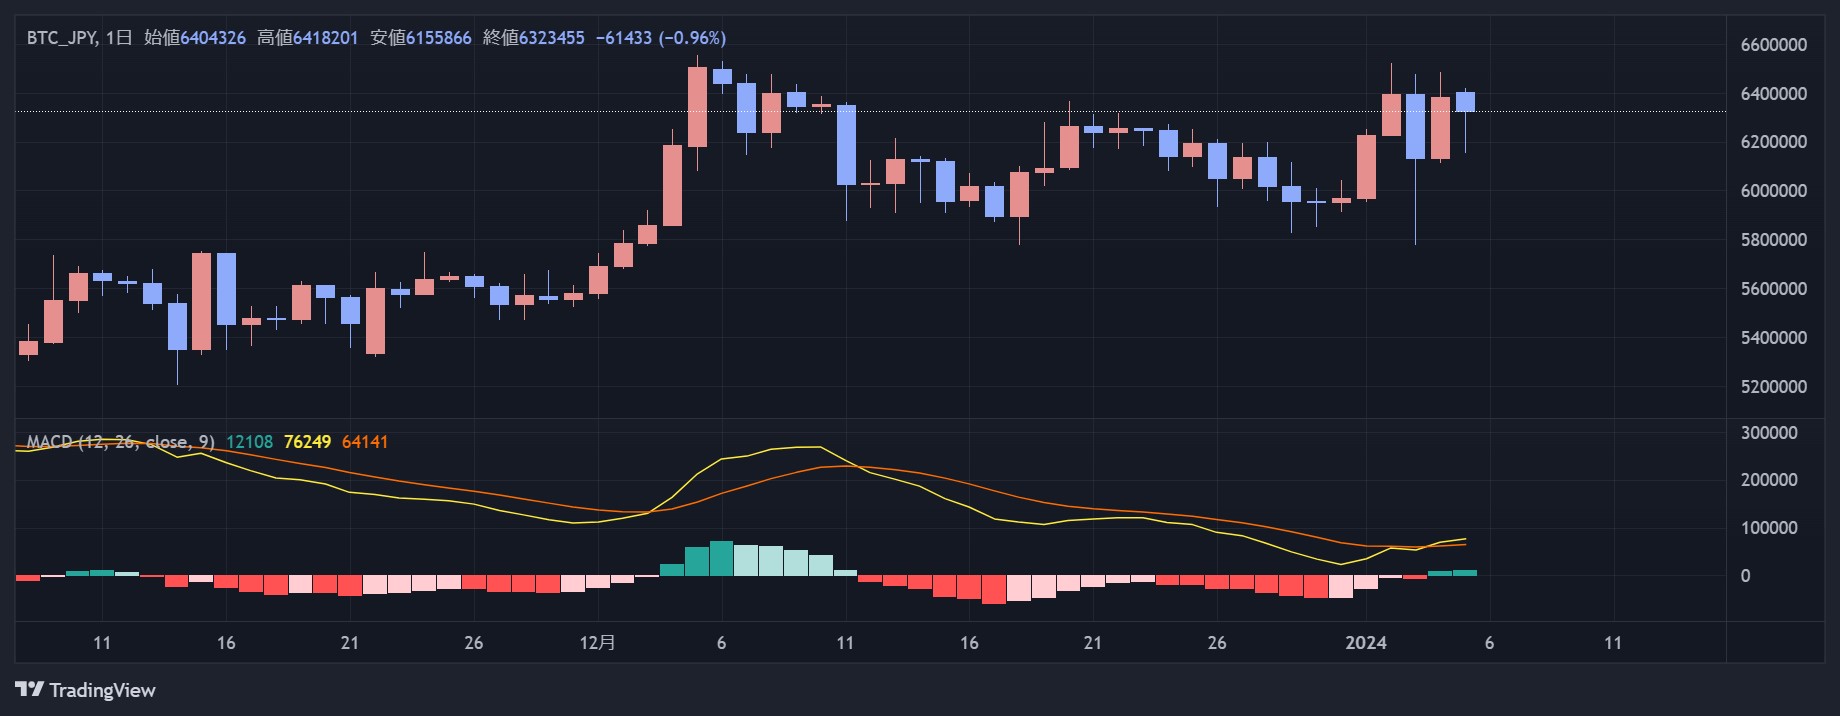

A slight golden cross occurs. However, both lines are almost flat, so we cannot feel safe yet.
Rating: 4
RSI
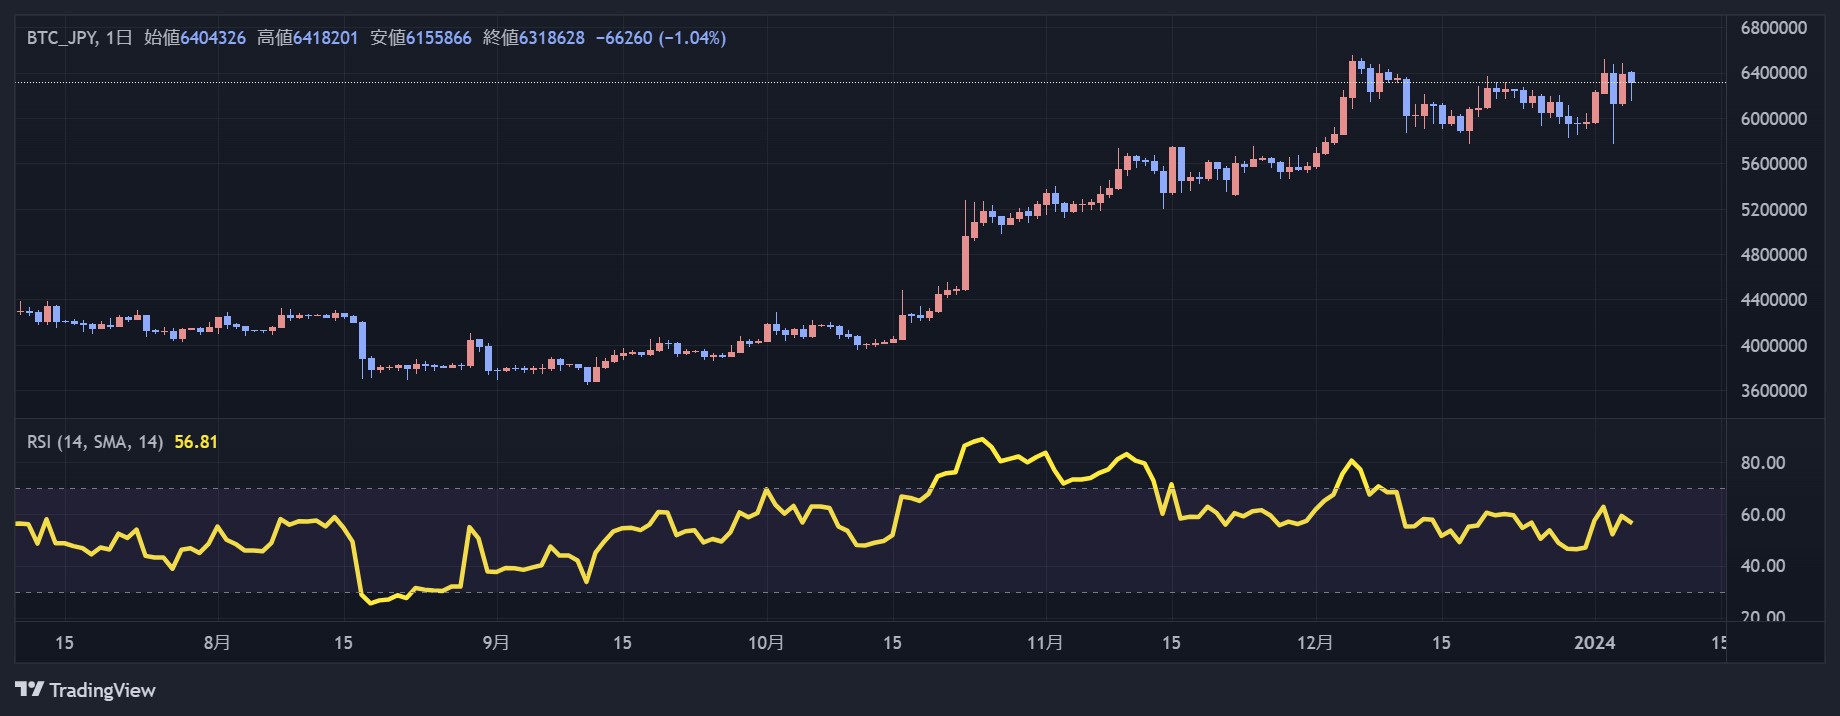

Around 50, I had no sense of direction.
Rating: 3
Rating

*This article is a reprint of the Rakuten Wallet technical report.
*This article provides information for reference when making investment decisions, but is not intended to recommend stocks or solicit investment activities. Furthermore, Rakuten Wallet does not solicit investments or make definitive predictions.
*The information sent may include future predictions, but it is the opinion of the individual sender, and its accuracy and reliability are not guaranteed. Please make your own final investment decisions.
The post Technical analysis using the matrix method (2024/1/5) How to determine the movement of Bitcoin and ETF after approval? : Rakuten Wallet | CoinDesk JAPAN appeared first on Our Bitcoin News.

 1 year ago
93





 English (US) ·