
The post Technicals Hints Bullish Reversal! Bitcoin (BTC) Price Need to Clear This Crucial Level To Continue Rally! appeared first on Coinpedia - Fintech & Cryptocurreny News Media| Crypto Guide
Major cryptocurrencies declined on Friday as Russia intensified its strikes on Ukraine. The global cryptocurrency market cap declined to the $1.83 trillion mark, dropping about 5 percent in the last 24 hours. Bitcoin’s market dominance fell 0.11 percent to 43.06 percent and the currency was trading at $41,430.77 on the morning of March 4.
Most of the altcoins were bleeding on Friday. Ethereum and Solana tumbled 7% each, whereas Avalanche and Cardano 6% each.
BTC Price Analysis
Bitcoin started a sharp decline falling below $42,000 levels. At the time of writing, the BTC price is trading at $41,391.76 with a 4% loss. Currently, we can expect reversal if the currency remains above the $42,000 Level. The first major resistance lies at $42,500.
On the downside, the major support lies at $40,200. however, a break below $40,000 might ignite a significant decline.
Bitcoin Price to Gain Momentum?
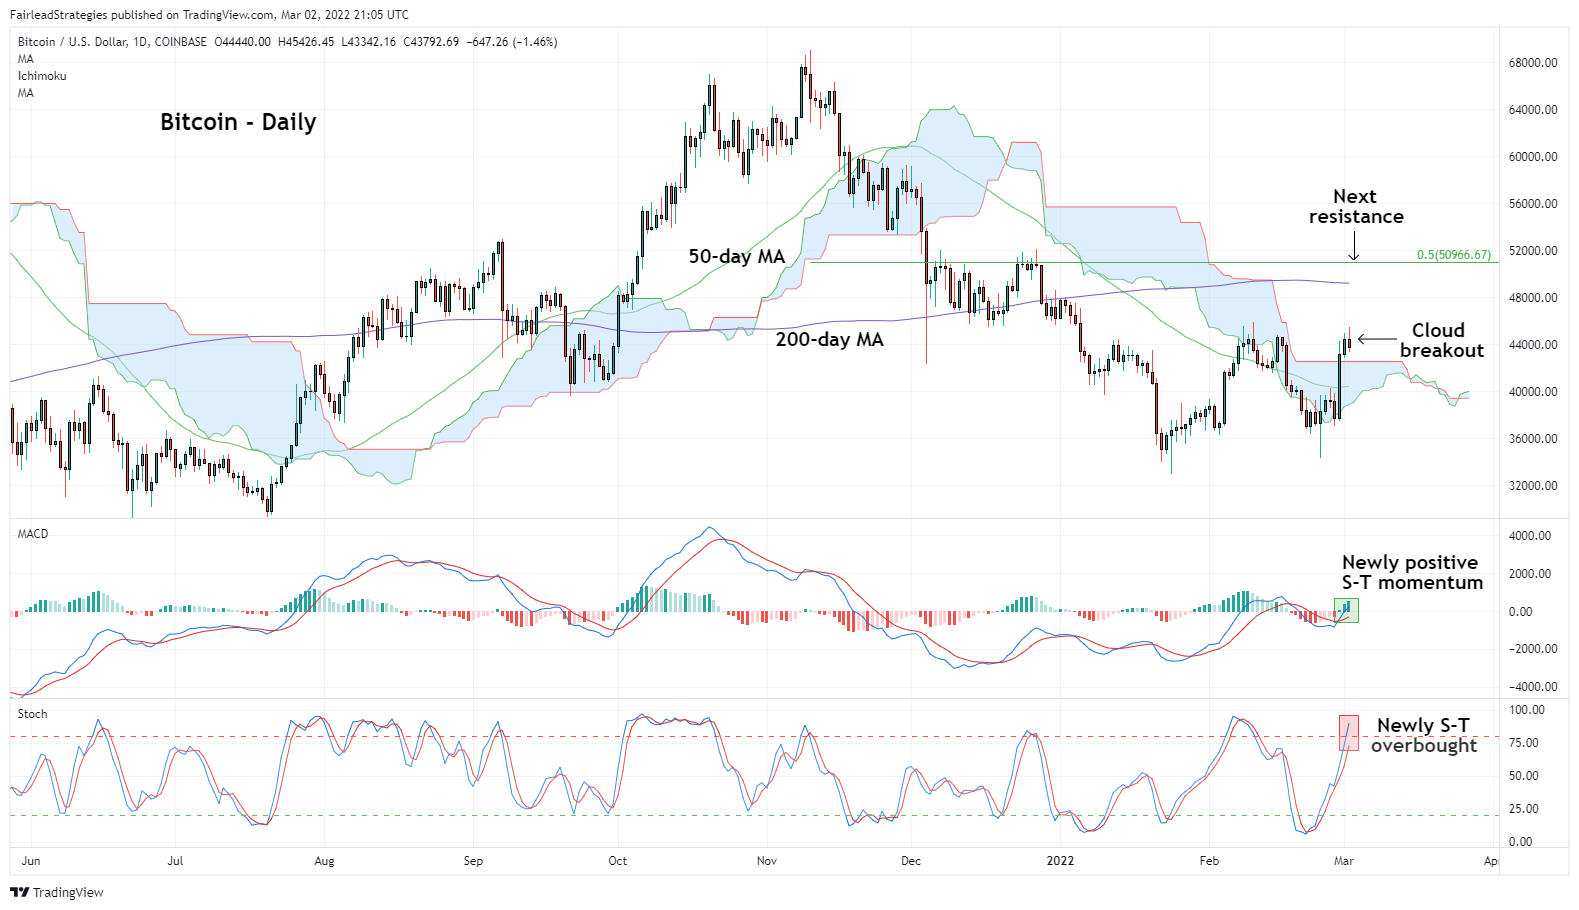
According to Fairlead Strategies, Bitcoin (BTC) appears to have turned the corner and could continue to gain momentum in the short term, citing a widely used technical instrument called Ichimoku cloud.
“Bitcoin has cleared resistance defined by the daily cloud, and it is likely to confirm its breakout upon today’s close, Fairlead Strategies’ CEO and managing partner Katie Stockton told CoinDesk in an email on Wednesday.
Despite trading slightly lower on Wednesday, bitcoin managed to close above the cloud confirming a bullish trend reversal. Based on the 200-day moving average (MA) and a 50% retracement level, the breakout reverses the intermediate-term downtrend and places the next big hurdle on the chart in the $50,000-$51,000 range, Stockton noted.
Also Read : Bitcoin Price Rally to Weaken the Dollar’s DXY Index, When Will BTC Price now Hit $50K?
The Ichimoku cloud was invented by Japanese journalist Goichi Hosoda in the late 1960s and consists of two lines: the leading span A and the leading span B. To show future support or resistance, both lines are displayed 26 days ahead of the last candle.
The indicator plots these lines using a complicated formula. Users, on the other hand, are not required to understand the inner workings of the indicator, as this is handled by chart providers, and may instead focus on deciphering the signals provided by the indicator.
The most recent breakout is supported by a bullish signal on the MACD histogram that is above zero. Stockton stated, “Our short-term gauges are pointing higher.”
So far, the breakout has failed to materialize, with the cryptocurrency currently trading above the $43,000 level. The stochastic on the daily chart is on the verge of flashing an overbought signal, indicating the possibility of a temporary consolidation before a move higher.


 English (US) ·