
In 2023, many asset management companies in the United States will apply for Bitcoin (BTC) spot ETFs (exchange traded funds) to the SEC (Securities and Exchange Commission), which oversees securities transactions such as stocks and bonds. We are doing BlackRock, a leading asset management company, has also entered the market, and market expectations are rising.
There is great interest among analysts and investors as to what kind of impact it will have if a Bitcoin spot ETF is actually approved in the US, and how it will affect the Bitcoin price. This is happening.
Bitcoin is sometimes referred to as “digital gold” because it shares similarities with gold in terms of scarcity, store of value, and decentralization. In addition, it is similar to gold in that it experienced a long-term bear market with the advent of the US futures market.
Therefore, analyzing the market impact of a physical gold ETF’s initial listing in the U.S. will provide valuable insight into predicting the future market impact of a Bitcoin ETF. .
In this article, we analyze the history of gold ETFs and their changes since their market launch, and explore the impact that Bitcoin ETFs will have on the market.
1-1. Gold “winter era” that lasted until the late 1990s
After peaking at $680 in 1980, it declined by approximately 60% to $260 in June 1999 Source: TradingView
In 1974, gold futures trading began on the New York Mercantile Exchange (COMEX), dramatically expanding investment access to gold. At that time, political and economic instability, rising inflation, the devaluation of the dollar, and the development of new opportunities in the gold market pushed up the price of gold.
Gold prices rose from $35 in the early 1970s to a peak of $680 in 1980.
However, from 1980 to the late 1990s, a “winter period” for gold occurred. During this period, the fall of the Berlin Wall and the dissolution of the Soviet Union reduced the structure of conflict between nations and the risk of conflict, and the world began to move toward stability, making gold less attractive.
In particular, interest rates on major currencies such as the US dollar and the Japanese yen were at a high level of around 5%, but the lease rate for gold remained at around 0.5%, making holding gold less attractive. As a result, gold prices entered a prolonged period of stagnation.
connection:What is the commodity asset “gold”? A safe asset with a versatile risk-hedging function
1-2. Turning point in the gold market in 1999
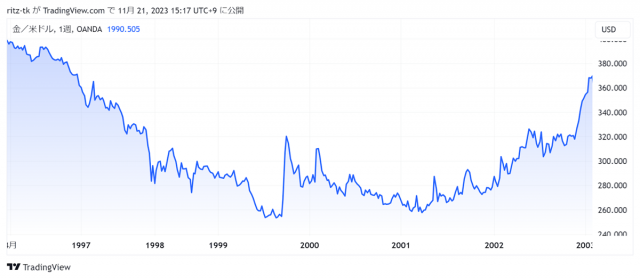
From a low of $250 in September 1999 to $368 in January 2003, an increase of approximately 45% Source: TradingView
1999 was an important turning point for the gold market. That year, Western European central banks signed the Central Bank Gold Agreement (CBGA), restricting gold sales to a maximum of 400 tonnes per year over the next five years, or a total of up to 2,000 tonnes. Lending of gold to the market was also restricted.
This agreement reduced the supply of gold, and the price of gold turned from falling to rising. Geopolitical risks such as the bursting of the Internet bubble and the terrorist attacks of September 11, 2001 have also played a role, and gold has once again attracted attention as a safe-haven asset in times of crisis.
Since 2001, the gold market has experienced a rapid rise. The move comes as mining companies, under pressure from shareholders, have shifted from a hedge selling strategy to one that anticipates rising gold prices. This change in strategy was a key factor in increasing momentum in the gold market. Furthermore, the accumulation of large short positions over 20 years is believed to have had a significant impact on market changes.
2. Impact on market prices due to the appearance of gold ETFs
2-1. In 2004, the first gold ETF in the US was born
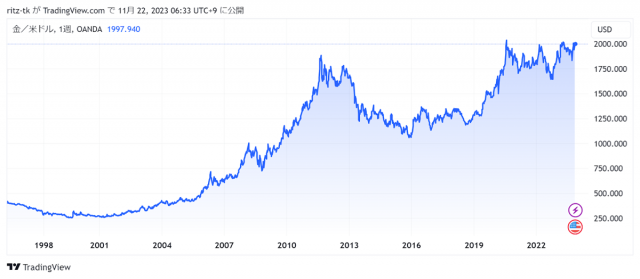
Approximately 300% increase from $450 in November 2004 to $1,825 in August 2011 Source: TradingView
2004 was a transformative year in the world of gold investing. That year, SPDR Gold Shares (GLD), produced by State Street Global Advisors, became the first physical gold ETF in the United States to be listed on the New York Stock Exchange (NYSE).
This listing has made it possible for institutional investors and individual investors to trade gold easily and at low cost through stock exchanges while minimizing risk.
The growth rate of gold ETFs has been remarkable. GLD, the first physical gold ETF in the United States, surpassed $1 billion in assets under management in just three business days after going public, and tripled within a year.
In 2003, before the ETF was listed, the gold price was around $400/troy ounce (TOZ), but since its listing in 2004, the price has increased rapidly. In 2011, it was recorded at $1,600/toz, and as of 2023, it is hovering around $2,000/toz, showing an increase of about 400% in 20 years.
The rise in prices in recent years has been influenced by a variety of factors, including financial crises such as the Lehman Shock, the deterioration of the situation in Ukraine, increased geopolitical risks due to the Middle East conflict, and global inflation (high prices).
2-2. Introducing gold ETFs expands the investor base in the physical gold market
The gold market has changed significantly with the introduction of physical ETFs. The shift in demand to gold ETFs was not just a shift away from the physical gold market, but resulted in a net increase in the overall market.
Gold ETFs and the physical gold market interact with each other, expanding the gold investment market and attracting a diverse range of investors. Gold ETFs have reduced the investment cost (premium) inherent in physical gold, driving average price growth and investment interest in gold.
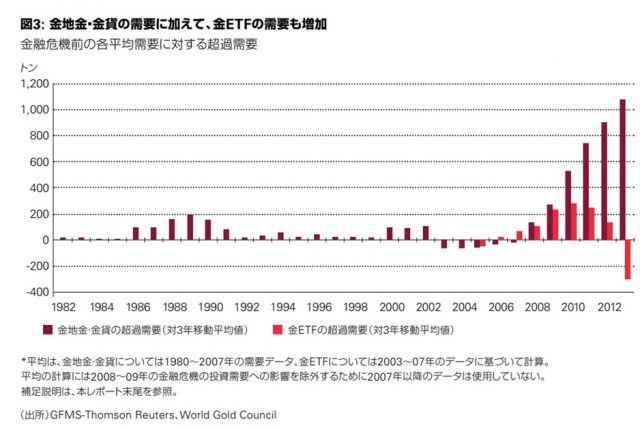
Excerpt from “10 years after the birth of gold ETFs, the market continues to maintain its true value” Source: World Gold Council
Since 2004, purchases of physical gold have outpaced demand for gold ETFs. In particular, investments in physical gold from 2008 to 2013 recorded significant growth, totaling more than 350%. Despite the outflows from gold ETFs in 2013, investors saw an opportunity to buy physical gold, and this trend continues.
3.Gold ETF market size trends
Starting with the launch of SPDR Gold Shares (GLD) on November 18, 2004, the market for gold ETFs continues to expand. On January 21, 2005, iShares Gold Trust (IAU), managed by BlackRock, began trading.
As of February 2023, there are 34 gold ETFs trading in the US market, with total assets under management of $112.01 billion and an average expense ratio of 0.62%. The introduction of these ETFs has greatly contributed to market efficiency, improved liquidity, and increased interest in gold.
List of major cash-backed gold ETFs
| GLD | SPDR Gold Shares | $56,906.60 | 7,616,380.00 |
| IAU | iShares Gold Trust | $25,609.90 | 6,278,365.00 |
| GLDM | SPDR Gold MiniShares Trust | $6,023.88 | 1,450,148.00 |
| SGOL | abrdn Physical Gold Shares ETF | $2,729.10 | 2,056,661.00 |
| BAR | GraniteShares Gold Shares | $923.74 | 807,482.00 |
| OUNZ | VanEck Merk Gold Trust | $744.79 | 1,118,935.00 |
| AAAU | Goldman Sachs Physical Gold ETF | $622.64 | 1,407,533.00 |
| GLDI | Credit Suisse X-Links Gold Shares Covered Call ETN | $80.02 | 2,789.00 |
| FGDL | Franklin Responsibly Sourced Gold ETF | $69.71 | 4,048.00 |
As of mid-November 2023, GLD holds approximately 883.43 tons of gold and IAU holds approximately 404.25 tons of gold, valued at $56.6 billion and $25.4 billion, respectively. Both ETFs hold top shares in the gold ETF market.
In September 2020, gold ETF holdings reached 3,880 tons and total assets under management reached USD 235.4 billion, setting a new record. Growth slowed down due to the subsequent strong US dollar, but as of the end of September 2023, the amount held remained at 3,282 tons. This corresponds to approximately 1.7% of the world’s gold supply.
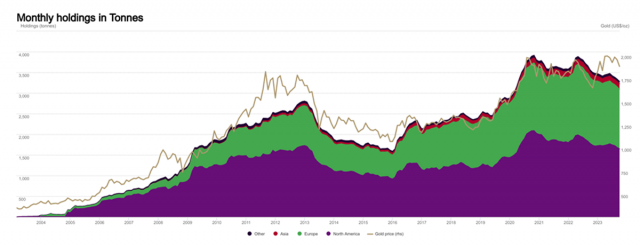
Monthly trends in ETF gold holdings Source: World Gold Council (Bloomberg, company submissions, ICE Benchmark Administration)
4. Advantages of gold ETFs for institutional investors
The most notable feature of gold ETFs is their high liquidity. In fact, gold ETFs listed in the US have such high liquidity that they rank in the top 20% of stocks in the S&P stock index. It is equivalent to ETF.
This high liquidity, combined with the large number of trading participants, results in tighter price spreads and market depth. This, combined with gold’s various benefits such as inflation hedging, portfolio diversification and asset preservation, makes it an attractive investment option for a wide range of investors, including institutional investors.
In the past, options for investing in gold included gold futures contracts, gold mining stocks, precious metals investment trusts, and physical gold holdings, but since 2003, gold ETFs have also been added to these options. Unlike futures contracts, gold ETFs do not have to worry about “contango” or “backwardation” that increase costs, and there is no need to make rollover or reinvestment decisions.
Additionally, many gold ETFs store their gold holdings in segregated accounts, which protects the ETF’s gold ownership even if the custodian defaults. This reduces counterparty risk.
These features of gold ETFs improve access to the gold market for all investor groups, from individuals to institutions, and contribute to the use of gold as a hedging asset, portfolio diversification and investment risk insurance. doing. Gold ETFs are attractive to a wide range of investors around the world, with the number of investors holding shares estimated to number in the millions.
5. Predicting the impact of Bitcoin ETF listing
Existing Bitcoin investment products have been criticized for closely resembling the state of the gold market before ETF approval, and suffer from high fees, low liquidity, and tracking errors. In contrast, the introduction of a physical Bitcoin ETF is expected to solve these problems and become a more efficient investment method.
Easier investment through brokerages could open up Bitcoin investment to retail investors and high-net-worth individuals, and could serve as an opportunity for institutional investors to start recognizing Bitcoin as a legitimate asset class.
Bitcoin is expected to be adopted in the portfolios of broker-dealers, banks, RIAs (Registered Investment Advisors), as well as 401(k) retirement plans and corporate pension funds. In total, the U.S. asset management industry manages approximately $48.3 trillion in assets, which are expected to be gradually allocated to Bitcoin ETFs.
Regarding the impact on the price, multiple specialized organizations have estimated the amount of capital inflow to Bitcoin ETFs by comparing it with the gold investment environment.
For example, Galaxy Digital predicts that if a Bitcoin spot ETF were to go public, it would generate at least $14.4 billion in new capital inflows in the first year and $38.6 billion in the third year. Analysis shows that the price of Bitcoin will increase by 74% in the first year after ETF approval.
connection:How will the BTC price change after Bitcoin ETF listing is approved?US investment company capital inflow forecast
There are also concerns about the increasing influence of institutional investors.
Institutional investors make large trades and can have a large impact on the market. In particular, the gold market experienced a sharp decline in 2013 due to the outflow of institutional investors from gold ETFs.
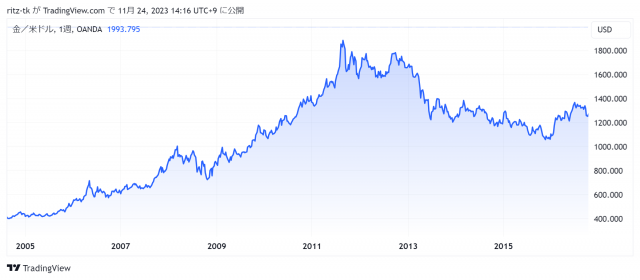
Throughout 2013, gold ETFs had outflows of 454.8 tonnes, exceeding the total inflows of the previous two years (446.67 tonnes). Gold prices fall to $1,100 per ounce. Source: TradingView
This decline is due to multiple factors, including the strengthening of the US dollar, the prospect of tapering quantitative easing from the Federal Reserve, and changing investor sentiment due to heavy selling of gold ETFs.
Many investors, including institutional investors, shifted their money to assets considered safer, such as U.S. Treasuries. This event shows that gold is highly influenced by economic conditions and expectations for changes in US monetary policy.
If the Bitcoin Spot ETF, like the Gold ETF, experiences institutional inflows, we would expect this to further increase the influence of institutional investors on the market.
Gold’s market capitalization is approximately $12.7 trillion, calculated based on an estimated price of $1,999 per ounce and a mined volume of approximately 200,000 tons, approximately 24 times that of Bitcoin. Galaxy Digital believes that over the long term, potential inflows into the Bitcoin investment market range from approximately $125 billion to $450 billion.
connection:If Bitcoin ETF approval follows the gold ETF market, there is a possibility of a 500% rise | TotalCrypto Report
Bitcoin ETF special feature
The post The history of the 2004 listed “Gold ETF” suggests the impact on the market price after Bitcoin ETF approval appeared first on Our Bitcoin News.

 1 year ago
93


![Humanity [H] hits $0.39 ATH after 138% surge – Will the rally hold?](https://ambcrypto.com/wp-content/uploads/2025/10/Gladys-45.webp)


 English (US) ·