The post This is When Bitcoin (BTC) Price Will likely Trigger a Run-up to $50,000 appeared first on Coinpedia - Fintech & Cryptocurreny News Media| Crypto Guide
After a day of slight recovery, the cryptocurrency market is yet again on a red signal as Bitcoin is pulled back trading below $41,000 which has positioned Ethereum and other major altcoins for a fresh decline. Right now the market is under deep pressure and has shown no sign of recovery due to its continued decline.
Bitcoin Technicals Say Bullish
Since April 4, the Bitcoin price has crashed by 17% landing Bitcoin price below the $40,000 range as well. This downswing has proved to be a bearish move as the price slides below the bullish trend between the 50-day and 100-day SMAs.
Meanwhile, the Bitcoin price action between January 22 and March 15 has made three higher highs and two higher lows and when these are connected with trend lines, the outcome shows an ascending parallel channel formation.
Bitcoin is set to have a bull rally towards $46,198 if the price bounces off 200 three-day SMA activating a full-blown reversal which will also see BTC Price surpassing the 50-day, 100-day SMAs. If the bullish cycle continues, the Bitcoin pressure could also revisit $48,169.
On-chain Metrics Indicate More Bullish Move For Bitcoin Price
The first metric, supply on exchanges tracks centralized entities that hold Bitcoin and this will support selling price pressure if things go wrong. However, since March 2020, this indicator is bearish for Bitcoin. The number of Bitcoins on exchanges has dropped to 1.91 million indicating that investors are positive in Bitcoin’s performance.

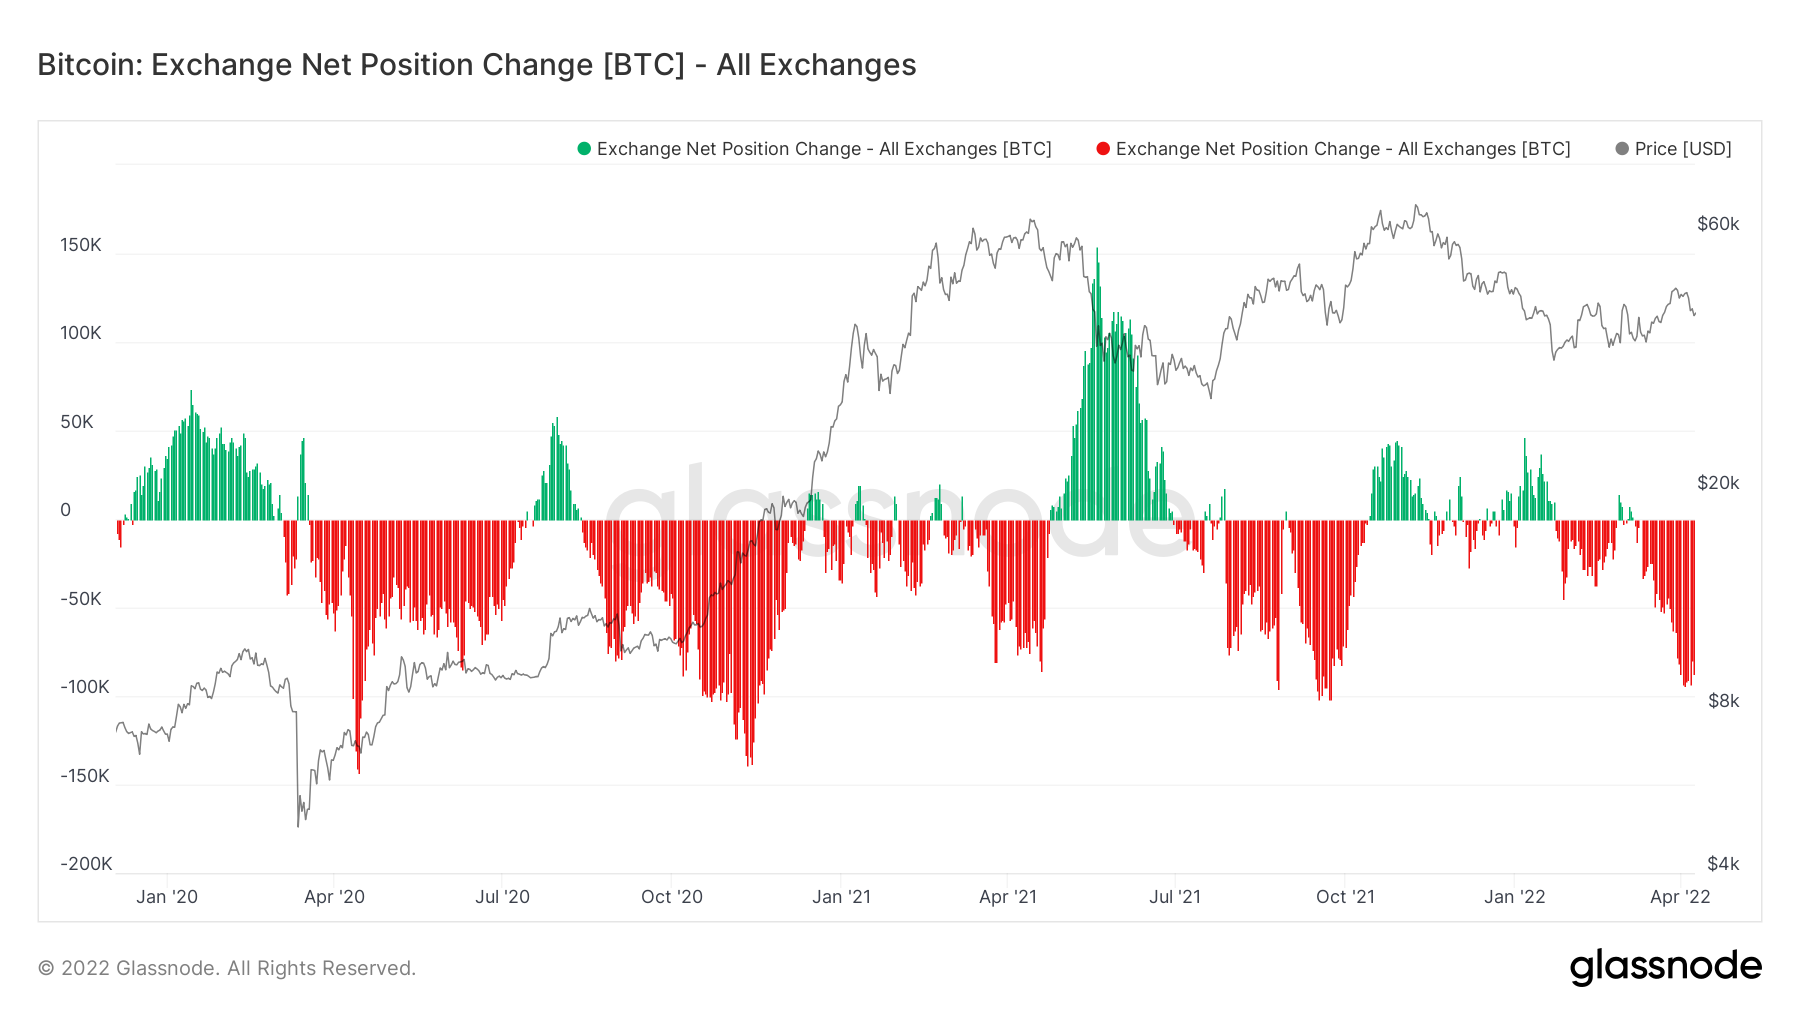
Next is the net position change indicator. This indicator follows the 30-day change in Bitcoins that sit on exchange wallets. This indicator reveals that, since March 2022, almost 100,000 Bitcoin have left the exchanges
Hence, all of these factors depict that investors are highly bullish on seeing better days for Bitcoin for over a long time.
Analyst Take On Crypto Market
TechDev, a popular on-chain analyst, informs his followers via Twitter that the market is under a year-long retracement and an impulsive move is likely to be seen.
The first sign is the bullish flip and a 100-day Moving Average (MA) retest and this pattern was also witnessed during the start of the 2017 bull rally.
In addition to this, the altcoins too have crossed the Exponential Moving Average (EMA) which is currently retesting. The same was also seen during the 2017 bull rally.
Lastly, TechDev talks about the dollar index (DXY) that is heading towards a local top, a similar structure found during the start of the 2017 rally.
To sum it up, the environment for Bitcoin price looks perfect for an approaching bull rally supported by on-chain indicators.

 3 years ago
173


 English (US) ·