
The post This is When STEPN(GMT) Price May hit $5 to Record a New ATH! appeared first on Coinpedia - Fintech & Cryptocurreny News Media| Crypto Guide
The Stepn (GMT) price in the past couple of hours maintained a significant upswing which pushed the price towards the new ATH at $4.11. The asset is facing a minor, short-lived rejection at present which may be flipped in the next couple of hours. GMT price from the beginning has made its place secured in the top trending coins and hence this may help it to gain huge bullish momentum.
The GMT price recently broke from the symmetrical consolidation as it reduced volatility after approaching the apex. The asset broke out from the 0.2 FIB levels to as high as 0.6 FIB levels in no time and also tested the 0.7 FIB levels, but failed. Despite a slight pullback, the asset is preparing to pull the next leg up.
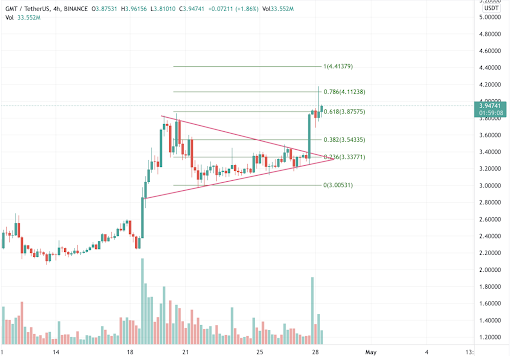
The asset is slowly heading towards the much-awaited levels around 0.7864 FIB levels which is around $4.11. Once cleared, the next pivot level to be looked for is the 1 FIB level at $4.413 and hence this may clear the path towards the much-awaited upper target at $5. However, may still believe the buyers may get exhausted but the buying volume remains accumulated, nullifying the possibility of a pullback.
Technical Specifications
| Indicators | Value | Action |
| Relative Strength Index (RSI) | 69.85 | Neutral |
| MACD | 0.1385 | Buy |
| Average Directional Index (ADX) | 41.25 | Neutral |
| Average True Range(ATR) | 0.1143 | Less Volatility |
| Bull-Bear Power | 0.2465 | Neutral |
The short-term forecast of the GMT price indicates a minor pullback as many indicators are neutral. The RSI is plunging down with the ADX represents the loss of strength of the rally and eventually visits the lower immediate support. However, it may be a short-lived one with a minor bearish divergence. And by the end of the month, the Stepn(GMT) price could rebound to test the most awaited target as.
Pivotal Points to Keep A Watch on
50-day Moving Average(MA):- $0.3.47
200-day Moving Average(MA):- NA
Resistance:- $3.97
Support:- $3.36


 English (US) ·