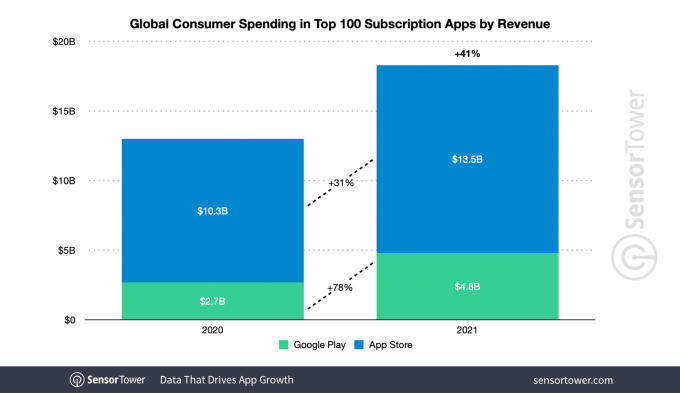
It’s no wonder why mobile publishers are battling to keep more of their subscription revenue out of the hands of platforms like Apple and Google — a new report indicates the top 100 non-game, subscription-based apps saw their consumer spend increase 41% in 2021 to $18.3 billion, up from $13 billion in 2020.
And this represents just a small portion (14%) of the overall revenue from in-app purchases across both apps and games, which totaled $131.6 billion in 2021, according to this latest data from app intelligence firm Sensor Tower.
However, this group’s portion of the market is growing. In 2020, subscription revenue in non-game apps represented just 11.7% of the total consumer spend for the year, for comparison.

Image Credits: Sensor Tower
The report also noted the 41% year-over-year increase in in-app purchase revenue in 2021 represented stronger growth than the 34% growth rate between 2019 and 2020.
Of course, the global coronavirus pandemic may have played a role here. In 2020 and beyond, consumers increasingly turned to apps for shopping, entertainment, health and fitness, work, education and more as the world adapted to lockdown measures, virtual work and schooling, and began to do more of their formerly in-person activities online — like shopping or events, for example.
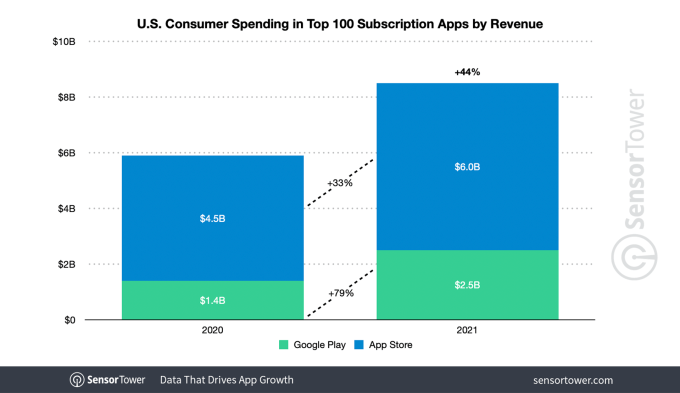
The U.S. figures mirrored the global trends when it came to mobile spending on subscriptions, the data showed. Last year, U.S. consumers spent $8.5 billion in the top 100 non-game subscription apps, up 44% from $5.9 billion in 2020 — more sizable growth than the 28% rise seen the year prior. In total, U.S. consumers spent $40.7 billion on in-app purchases in 2021.

Image Credits: Sensor Tower
Subscriptions have also become the dominant means of driving app store revenue. In the fourth quarter, 90 out of the top 100 top-grossing U.S. apps included a subscription. This figure is only slightly down from the 91 in Q4 2020 or the 93 in Q4 2019.
Apple’s App Store continues to outpace Google Play when it comes to subscription revenue. Last year, the top 100 non-game subscription apps on the App Store saw nearly three times as much spending as those on Google Play, at $13.5 billion versus $4.8 billion, respectively. This represented 31% year-over-year growth from $10.3 billion for the same group on the App Store in 2020, and 78% growth from the $2.7 billion for the group on Google Play.
The U.S., again, saw a similar trend. Here, the top 100 subscription apps on the App Store grew 33% year-over-year from $4.5 billion in 2020 to reach $6 billion in 2021. Subscription apps on Google Play, meanwhile, grew 79% from $1.4 billion in 2020 to reach $2.5 billion in 2021.

Image Credits: Sensor Tower
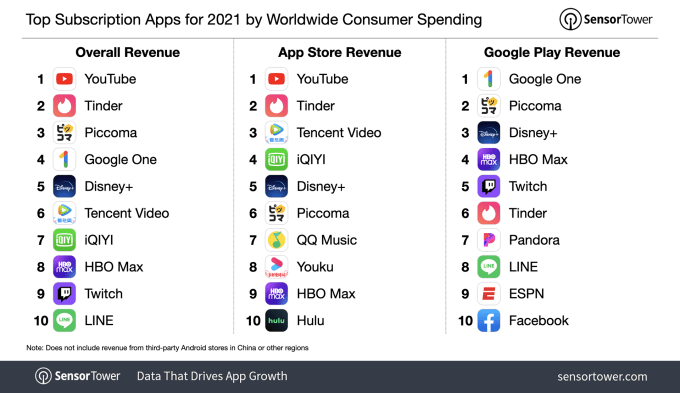
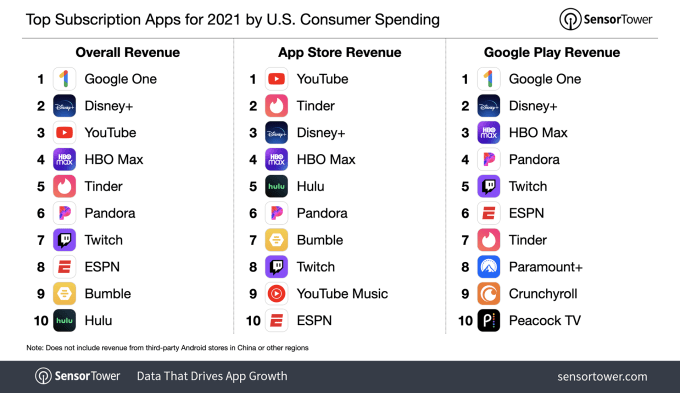
Google’s apps top the charts, alongside other streaming and dating apps, when it comes to consumer spending. Google’s subscription service Google One made $1.1 billion worldwide last year via its app, $698 million of which was from the U.S. And Google’s YouTube app made $1.2 billion last year, $566.5 million of which was from the U.S.
Other top-grossing U.S. apps included Disney+, HBO Max and Tinder. Worldwide, you can add Piccoma to that list.

Image Credits: Sensor Tower
Analysis of the subscription market like this is interesting, given the increased regulatory scrutiny of the apps stores’ business models over the past year.
Some markets, like South Korea, even passed new laws to limit Apple and Google’s control over in-app purchases. Currently, Dutch regulators are in a standoff with Apple over dating apps’ payments, claiming Apple is in violation of antitrust orders. And while this data is only examining the non-gaming trends, the money that app stores make from gaming companies is also massive — which is why Epic Games, for instance, is appealing the court’s decision in its own antitrust case.


 English (US) ·