The post TRX Short Sellers Face $2M Liquidation, Will Bulls Step In? appeared first on Coinpedia Fintech News
As the overall cryptocurrency market begins to recover, Tron (TRX) appears bullish, with over a million dollars worth of traders’ short positions on the verge of liquidation. Since the beginning of February 2024, TRX has been moving within a parallel channel pattern between $0.22 and $0.25.
TRX Current Price Momentum
However, TRX is currently trading near $0.223 and has remained stable over the past 24 hours. During the same period, its trading volume dropped by 15%, indicating that traders and investors are more hesitant to participate compared to the previous day.
Traders Over-Leveraged Positions
Data from the on-chain analytics firm Coinglass revealed that traders are currently over-leveraged at $0.2167 on the lower side, believing that the asset price won’t fall below this level. They currently hold $4.30 million worth of long positions.
Meanwhile, $0.2257 is another over-leveraged level, where traders betting on the bearish side hold $2 million worth of short positions, believing that the price won’t exceed the $0.2257 level.
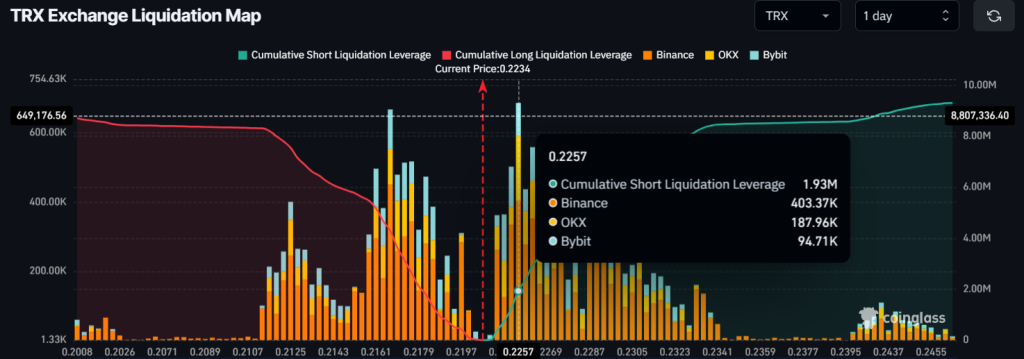 Source: Coinglass
Looking at the current market situation, TRX’s price appears to be moving upward and seems poised for a rally soon.
Tron (TRX) Price Action and Upcoming Levels
Amid the recent market uncertainty, the asset has reached the lower level of the channel pattern and appears to be consolidating. According to expert technical analysis, TRX is poised for an upside rally, but the rally will begin only once the asset breaks out of consolidation.
Based on recent price action and historical momentum, if the asset breaks out of consolidation and closes a daily candle above the $0.225 level, there is a strong possibility it could surge by 11% to reach $0.25 in the coming days.
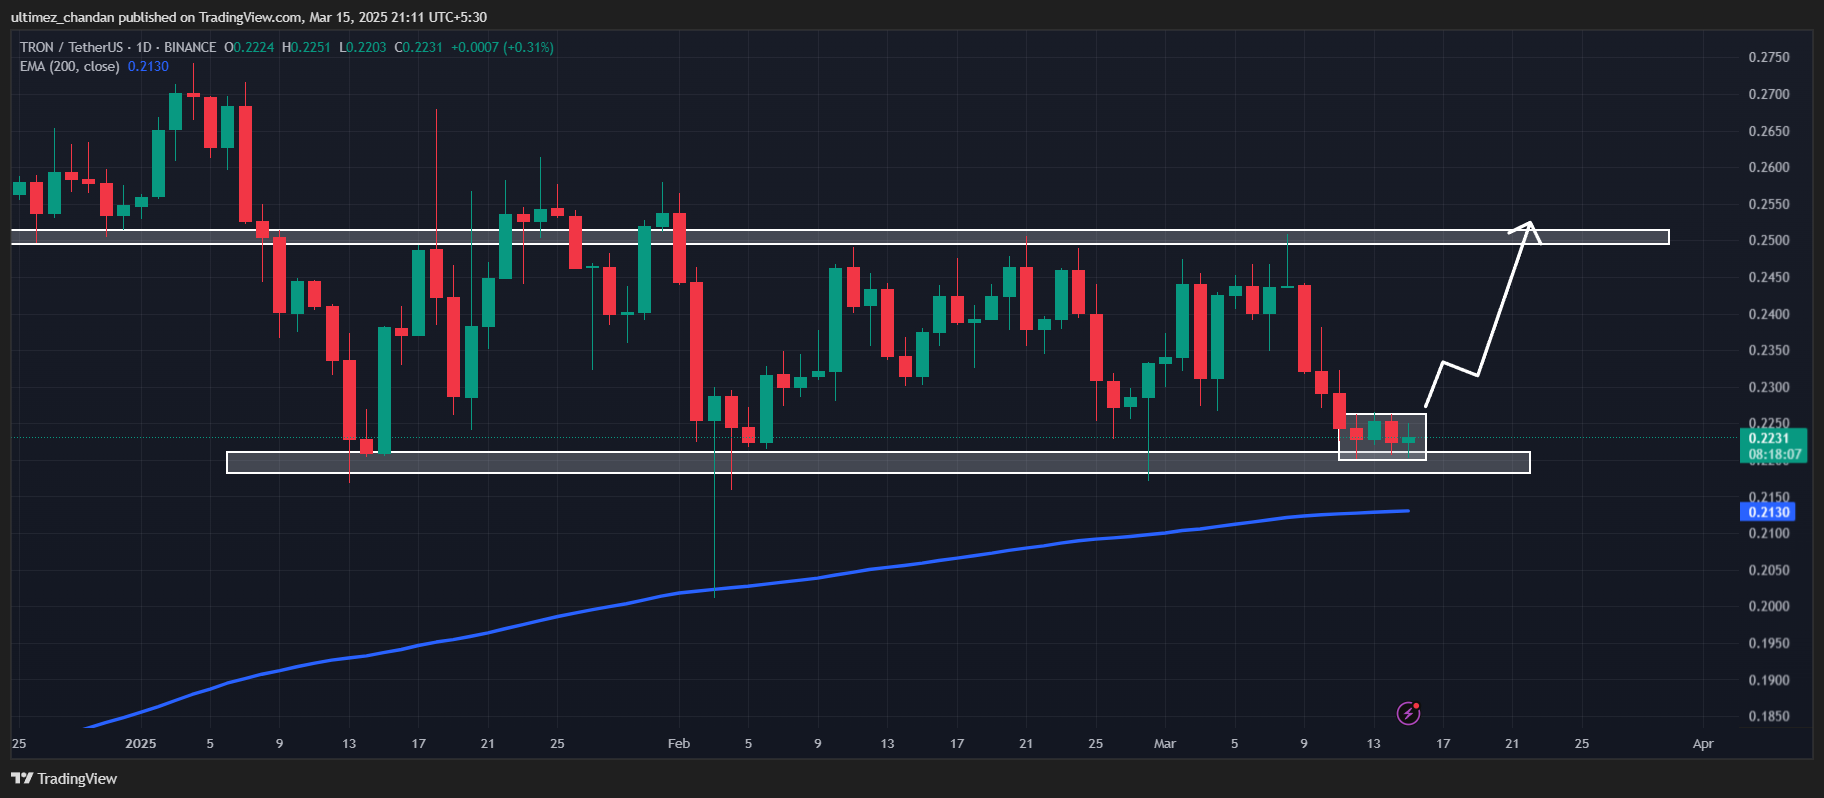 Source: Trading View
Despite the ongoing struggle, the asset has remained above the 200 Exponential Moving Average (EMA) on the daily timeframe, which typically indicates a bullish trend rather than a downtrend.


 English (US) ·