Wondering how to improve the marketing performance of your mobile app in the spring without experimenting and extra costs? Take advantage of results from the high winter season, also known as Q5.
The tremendous amount of data received during the winter holidays can improve your marketing strategy and boost your app growth. Here’s how to extract insights that will make this approach work, enhance your ad creative strategy, transform hypotheses into proven facts, personalize your product and increase lifetime value.
What (or when) is Q5?
Q5 is a high season for marketing in the mobile app field. Though it takes place only during the winter holidays, its results equal the whole quarter in revenue. But it is not only a winter story. Q5 can be of use in the spring and summer seasons as well.
Why is Q5 data so valuable?
- You get a more expensive audience. The business period of e-commerce ends right after Christmas, when mobile apps come into play. As e-commerce is the largest rival of mobile apps in terms of digital advertising, reduced e-commerce ads frees up the market for apps, which allows app campaigns to get more reach for less money. They also get access to a more expensive and, as a result, more affluent audience at a lower cost than usual.
- Gain a deeper understanding of users’ behavior. Many people make resolutions at the beginning of the year to become better versions of themselves. The “New Year’s resolution” mindset makes people ready to invest in themselves. And that makes Q5 incredibly successful for fitness, health, self-growth and education apps.
- Higher engagement rates. During the Christmas holidays, people spend more time at home and, of course, on their phones. Accordingly, app ads get more of their attention.
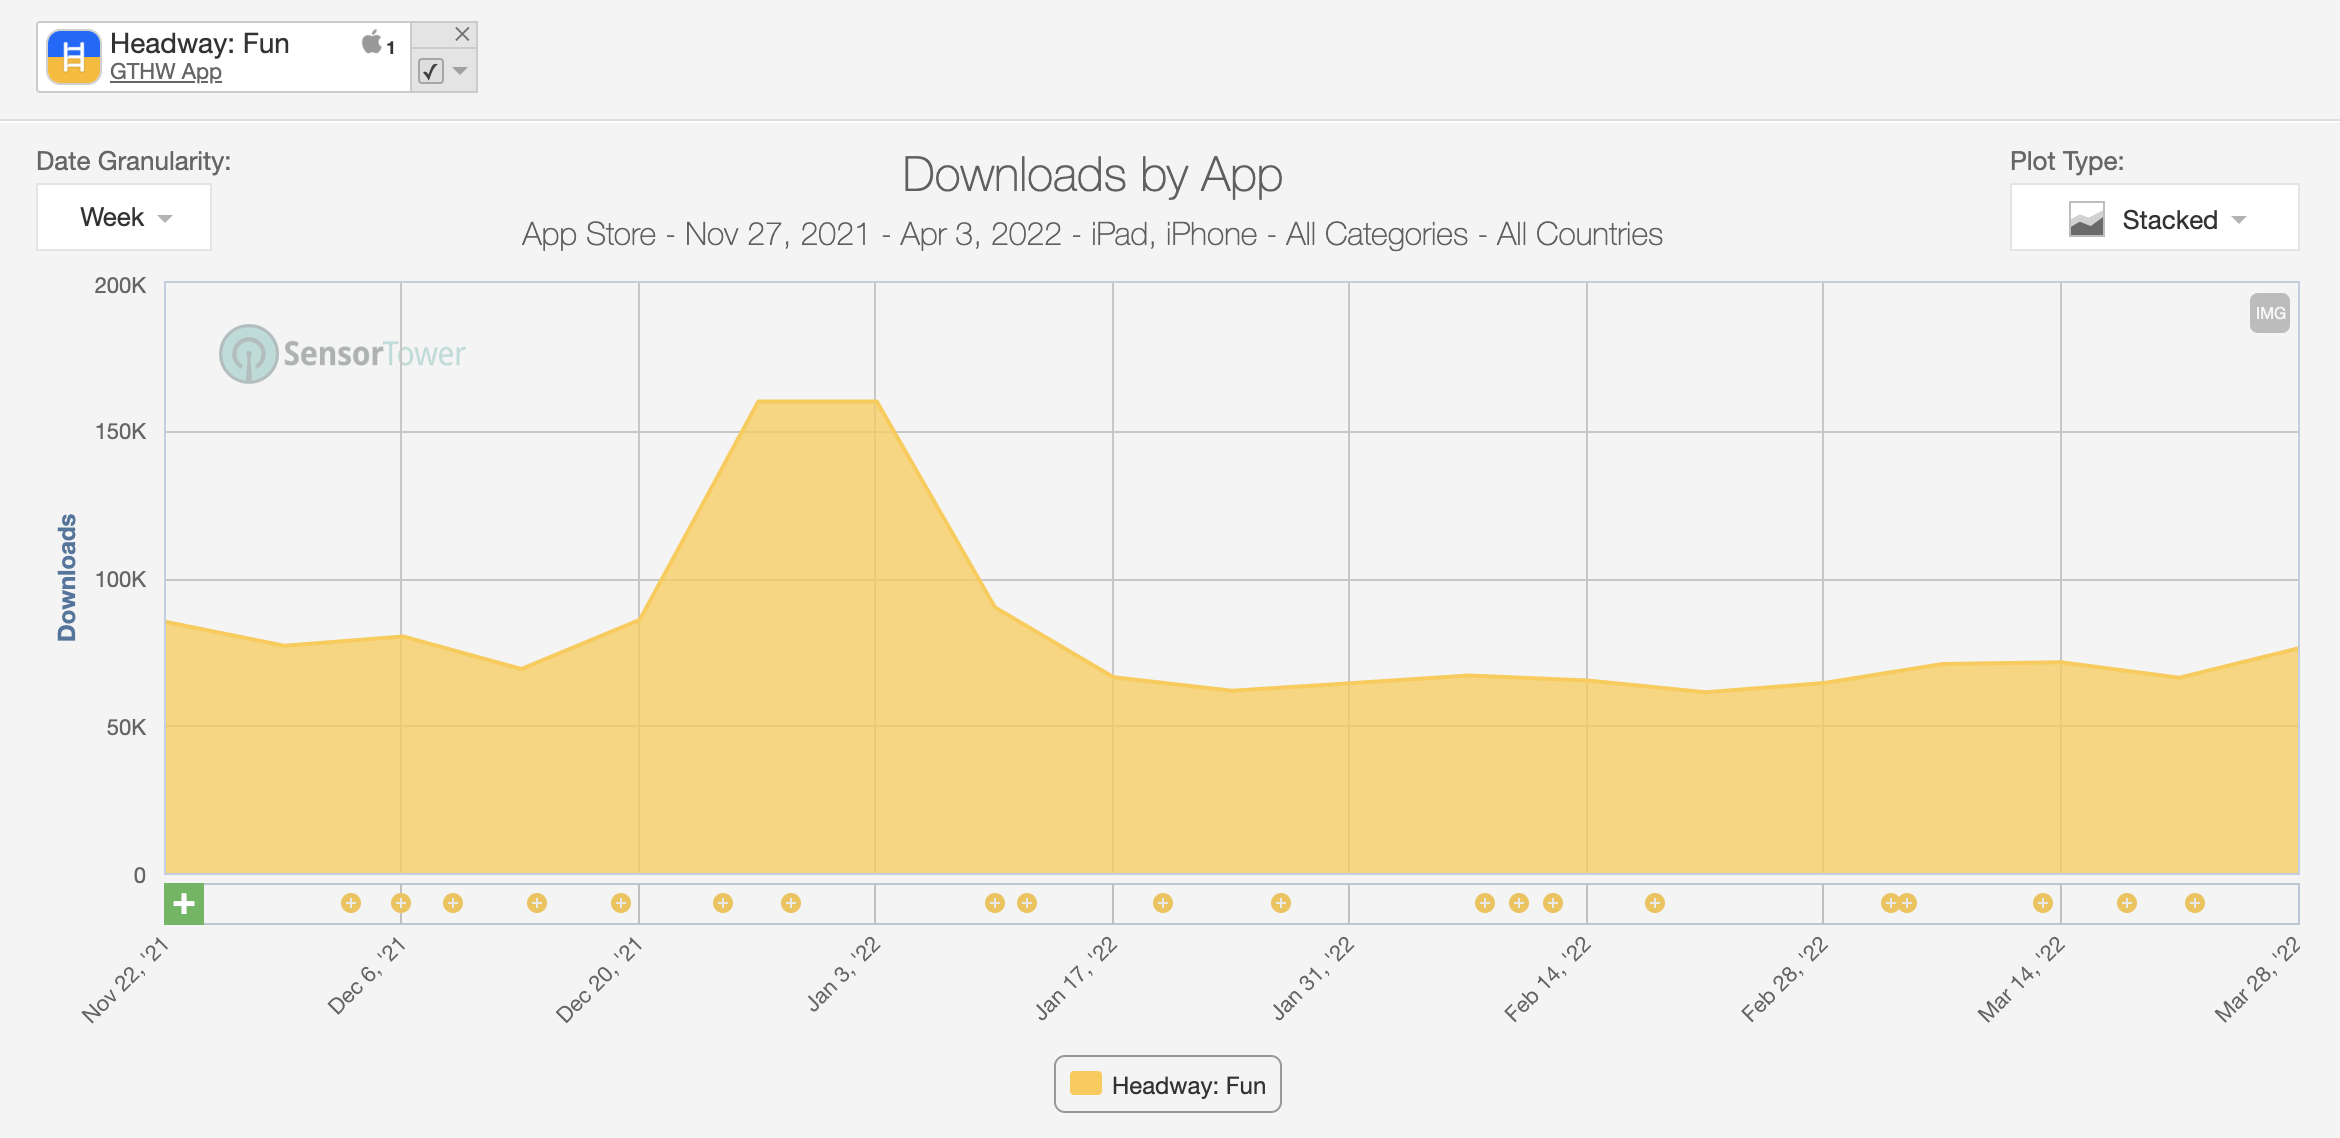
All these reasons help mobile apps grow in profit. For instance, the revenue of the Headway app increased 200% compared to other periods.

Headway app data from Sensor Tower. Image Credits: Headway
Four ways to leverage data from Q5 right now
Improve your creative ad strategy
During Q5, you can estimate your hourly traffic more effectively to build a daily trend. Because you get much more traffic than usual, trends begin to appear. After building your daily trend, you can extrapolate it for the following periods.
For example, we noticed that our ads performed better in the morning and evening — right at commute times. We couldn’t discern this trend clearly during normal times, but a significant amount of traffic during Q5 made it crystal clear for us. So, based on this discovery, we’ve changed our creatives. Now, we tell people that they can effectively spend their downtime with our app.
Estimating traffic on an hourly basis can help identify top-performing ad creatives much faster. You will incur fewer ineffective costs when you notice them and start scaling in different variations. And as a result, you get more revenue from top performers.
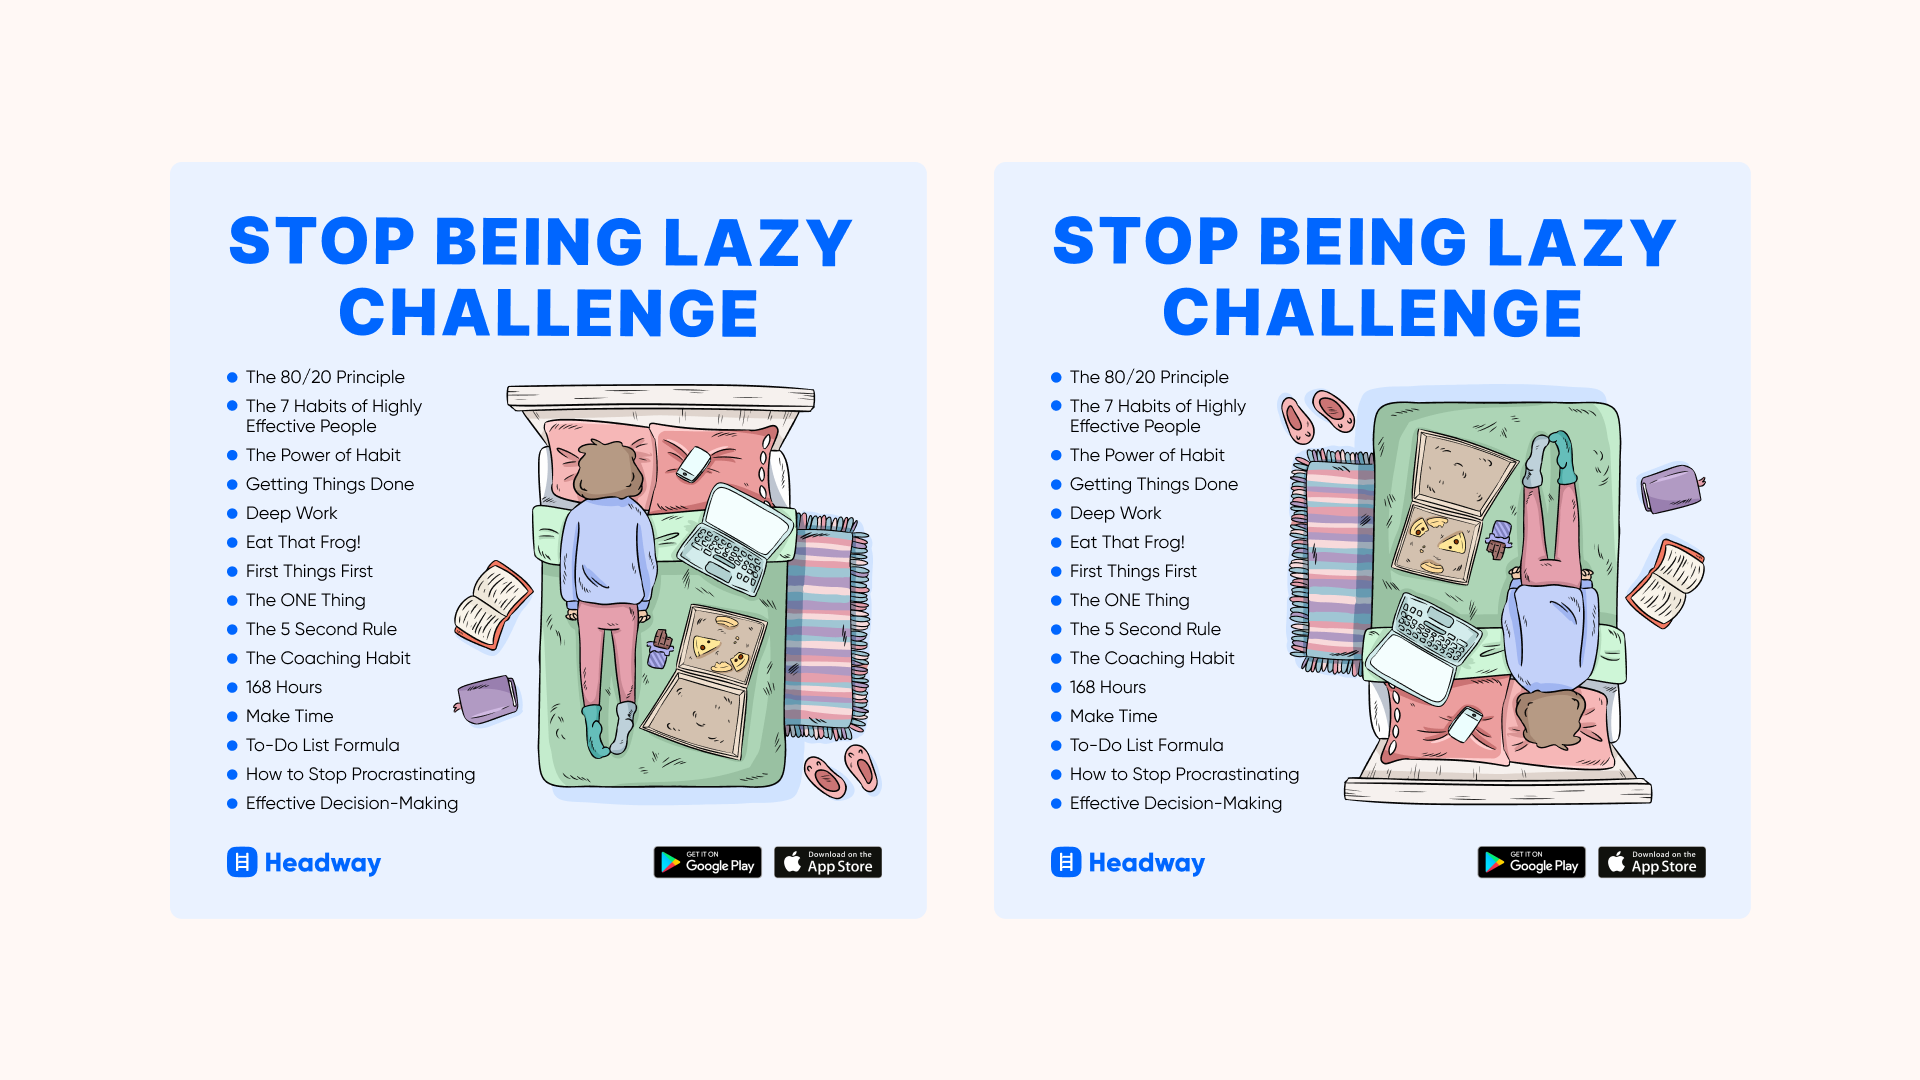
When our team notices a top-performing ad, we scale it in a variety of ways. For example, changing the placement or using an image with a different ad copy. Once, we decided to experiment more and randomly rotated a bed on an ad about procrastination. The creative continued performing with the bed in a new position and was even more successful than the previous version. From that time on, we haven’t hesitated to change such tiny details, because even minor tweaks can be significant for Facebook ads on a large amount of traffic.

Image Credits: Headway
Transform your hypothesis into proven facts
During Q5, marketers usually try new creatives and ad placements that they hesitated to use at other times of the year. It’s a great strategy to follow because you can check your hypothesis on a much broader audience and draw some conclusions. But don’t limit this approach only to the Q5 period. Use verified ad techniques to boost your upcoming year’s marketing strategy. But how do you apply it in practice?
Earlier, we thought that our Instagram feed was the best ad placement for us and didn’t believe that Reels would work as well. We tested this ad placement a couple of times, but it didn’t appear efficient enough. Therefore, we put it aside and decided to give it a try on a massive audience during Q5. Eventually, it worked well. With a great amount of cheaper traffic, we not only validated Reels as a successful ad placement but also created a strategy for our regular ads on Instagram Reels.
Improve marketing metrics through cheaper access to expensive audiences
Subscription model apps can increase their LTV (customer lifetime value) by getting new audiences that weren’t accessible before. How does it work?
Let’s say you usually reach users with a $15 CPM (cost per thousand). You would like to get users with a $25 CPM, but they are expensive for you. Since prices drop during Q5, these “expensive” users become “affordable.”
But why do you need more expensive users instead of reaching your good old $15 CPM users at a much lower price? Because the higher the CPM, the greater the users’ purchasing power. Therefore, users with a $25 CPM are more likely to convert to purchase than those with a $15 CPM. So, a more expensive audience has a higher potential to buy a subscription on your app after the trial and a better chance of renewing it after a month or a year.
As you get more users with greater purchasing power in your app, the LTV increases. This approach also helps you accumulate a margin of safety for subsequent less favorable periods for your app.
Now that you know your users better, personalize more
A huge amount of data from new creatives, new users and new ad techniques gives you many insights to use throughout the year after Q5. So don’t miss your chance to maximize these insights.
First, analyze and draw conclusions by observing users’ behavior during this period. How did they behave in your store, during onboarding, on the payment wall and during the trial? Is there a correlation between the creative that users came from and their behavior in the app? Second, turn these insights into an action plan to improve your product and personalize more.
This method enhanced our work: During Q5, we noticed that our ad creative about decision fatigue became one of the top performers, and many users converted to purchasers because of it. Therefore, we had two hypotheses: First, this topic is highly relevant to our users, and we have to create more content about it. Second, users like the layout of the ad creative, so we can use its visual element for the onboarding screen. We tried both hypotheses, tested them and got positive results. As a result, we use both approaches in our app.
Using these methods, you can come back to insights from Q5 throughout the year to improve your marketing strategy and your product.


 English (US) ·