
The post Watch Your Trade : XRP Struggles At $2.5, SUI Surges 7% And HBAR Poised For $0.33 appeared first on Coinpedia Fintech News
Key Highlights
- XRP price has fallen by 1.23% on Friday after correcting nearly 24% this week.
- SUI price struggles below $3; can the WLFI partnership and SUI ETF speculation lead to a reversal?
- HBAR must breach the $0.255 resistance to break its downtrend.
Can XRP hit $3 or Drop below $2.37?
Similar to Bitcoin and Ethereum, the XRP price began a recovery wave from the $2.20 level. The price was able to move above the $2.55 resistance level. However, bears were aggressive around $2.640. The price corrected some gains and dipped below $2.54.
The XRP/USD pair’s hourly chart showed a break below a connecting positive trend line with support at $2.550. The pair fell below the 50% Fibonacci retracement level of the upward run from the $2.211 swing low to the $2.6390 high.
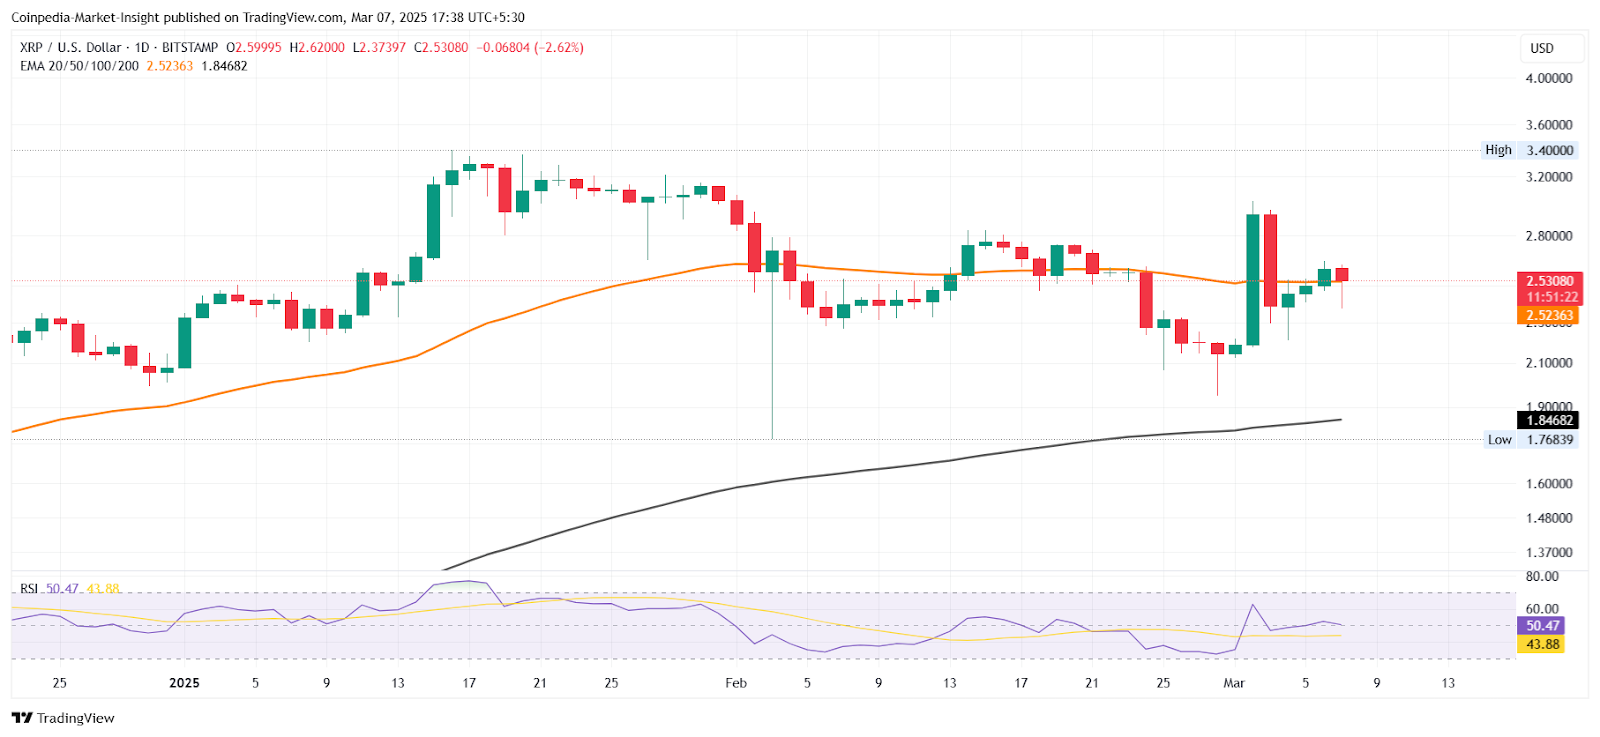
The first significant resistance is located near the $2.5702. The next resistance is $2.640. A clear break above the $2.640 resistance might propel the XRP price into the $2.720 barrier. In the short term, any additional moves might push the price toward the $2.80 resistance level or even $2.850. The next major hurdle for the bulls could be $3.00.
If XRP fails to break through the $2.5702 resistance level, it could begin another drop. Initial downward support is near $2.4250. The next significant support level is at $2.3750, which is also the 61.8% Fib retracement level of the upward advance from the $2.211 swing low to the $2.6390 high.
SUI Trading Volume Surpasses $20B, SUI to Break $3?
The SUI coin defies market slump, surging 7%, from $2.6845 to $2.97 on Friday after Sui coin trading volume surged past $20 billion, signaling a potential shift in market dynamics. SUI price hike is also fueled by a strategic partnership with Trump-linked DeFi protocol World Liberty Financial (WLFI) and news that Canary Capital filed to establish a trust entity in Delaware for its proposed Canary SUI ETF.
On the technical side, SUI continues to trade below the $3 mark, struggling to gain momentum. At 59.97, the relative strength indicator(RSI) suggests that the asset is not oversold but remains in neutral territory.
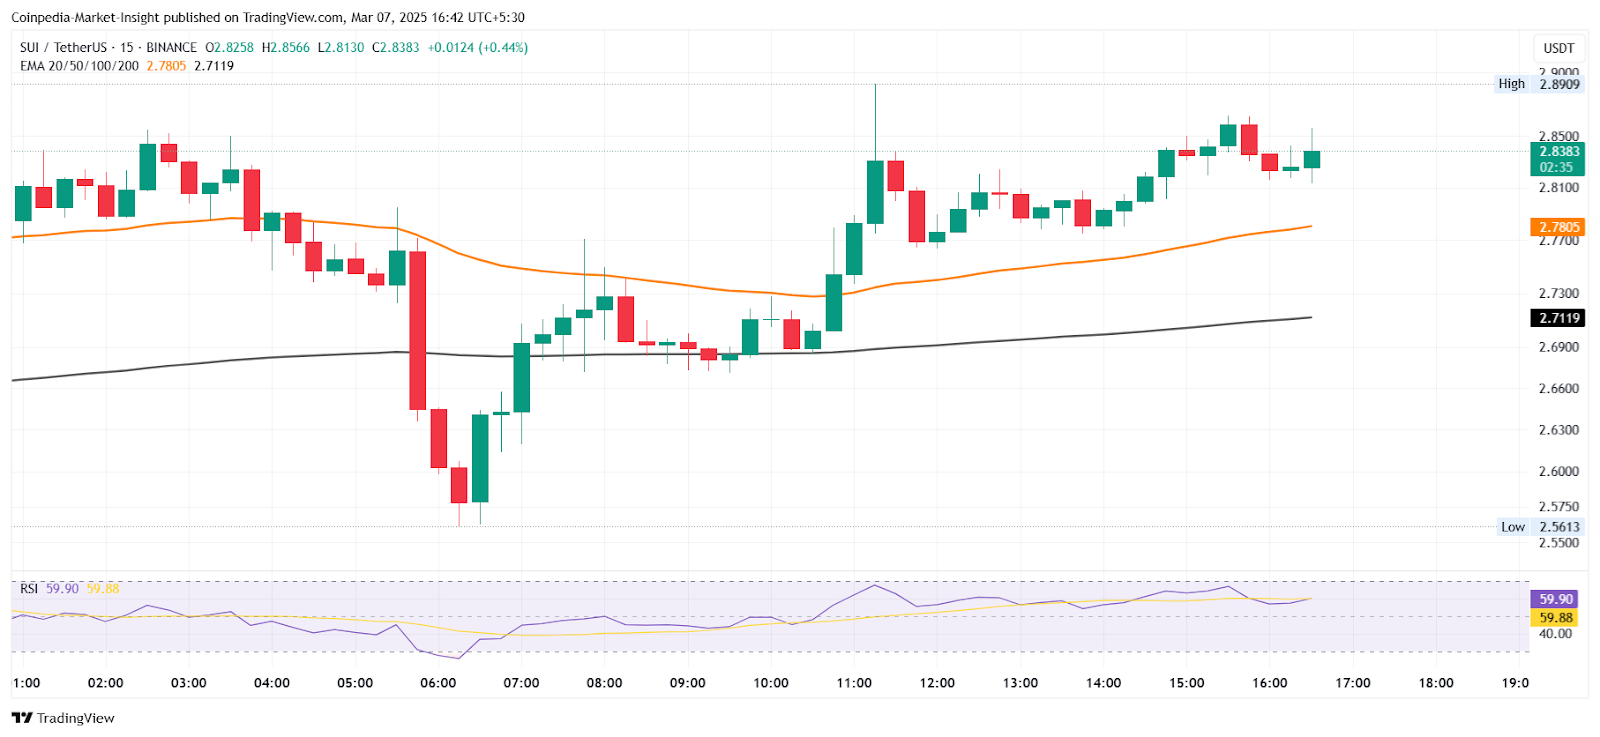
The 50-day EMA, $3.35, and the 200-day EMA, $3.02, both indicate a bearish trend. If selling pressure increases, support is found between $2.70 and $2.50, with resistance at $3.57.
Meanwhile, a 14.53% increase in open interest ($664 million) over the past 24 hours, indicating growing market activity. Although a breakthrough above $3 could boost momentum, a longer-term recovery will require higher demand and better-decentralized finance activity.
Hedera’s HBAR Set For $0.33?
HBAR’s price has soared by more than 1% in the last 24 hours, and it is now trading at $0.25. Furthermore, Coinpedia reports that Hedera has increased by up to 32% over the last seven days.
HBAR/USDT is now in a bullish phase, supported by the EMA structure. The (20, 50, 100, 200)-day Exponential Moving Averages (EMAs) show the 20 EMA passing above the 50 EMA, indicating bullish momentum. The 200 EMA is currently performing as a dynamic support level at 0.24414 USDT.
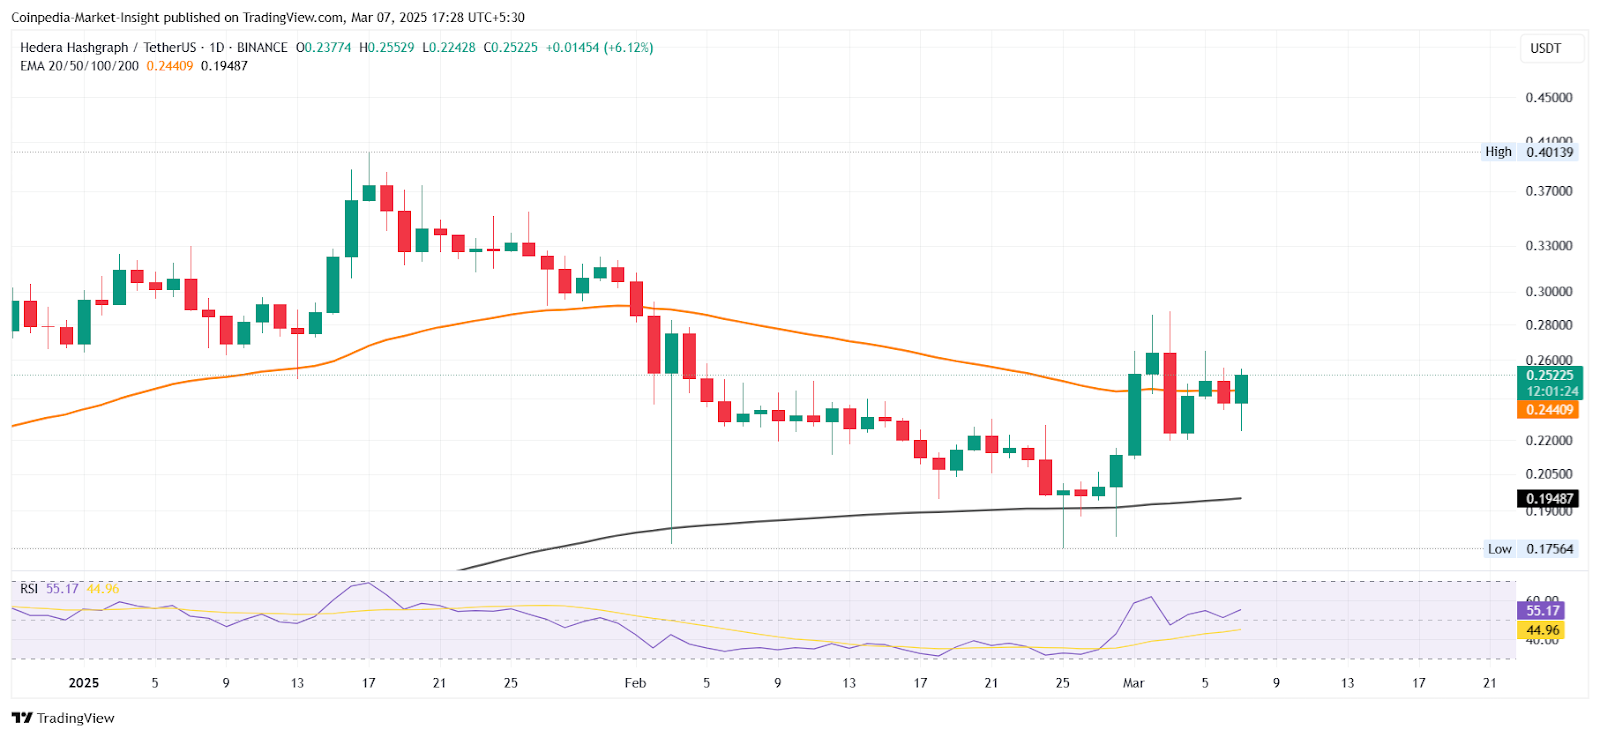
This symmetrical triangular pattern on the hourly HBAR price charts, shown by yellow solid lines, is centered around the trend line of $0.255. If the positive momentum continues, the immediate resistance is $2.88. A breakout might take the price above $0.3306.


 English (US) ·