The post Will These Altcoins Surge 2x With A Breakout Rally? appeared first on Coinpedia Fintech News
With a positive trend in Bitcoin and altcoins this week, the demand in the crypto market is evidently increasing. As the top gainers are making noise, here are some altcoins ready for a breakout rally this week. Will these coins surge 100% as the broader market recovers with their breakout runs? Let’s find out.
Top Performing Altcoins To Watch Out: Helium (HNT)
With a market cap of $1.16 billion, Helium is rising ranks in the top 100 crypto list and is stationed at #58. As one of the top-performing altcoins, the 7-day growth in HNT price is 54.20%.
In the daily chart, the HNT price reveals a trendline breakout rally surpassing the 61.80% Fibonacci level at $7.306. However, an intraday pullback warns of a retest phase to the 50% Fibonacci level at $6.458.
Currently, the Helium token price trades at $7.216 with an intraday pullback of 2.97%. As per the Fib levels, a lower price rejection propelling the altcoin prices could hit the $10 psychological mark.
Aptos (APT)
Similar to Helium and other top performing altcoins, the APT price concludes a long-term correction phase with a resistance trendline breakout. As the bull run exceeds the 20D and 50D EMA, the altcoin has increased by 59% within 10 days from the low of $4.32.
Currently, the APT price trades at $6.81 with a minimal intraday movement following the 5.75% jump last night. Despite the breakout event, Aptos has to face multiple dynamic resistances: 100D and 200D EMA along with the 23.60% Fib level at $8.11.
A bullish trend continuing above the $8.11 will signal a massive trend reversal in Aptos. This will also increase the golden crossover chances. Optimistically, the uptrend in the APT price could hit the $15.28 mark.
Celestia (TIA)
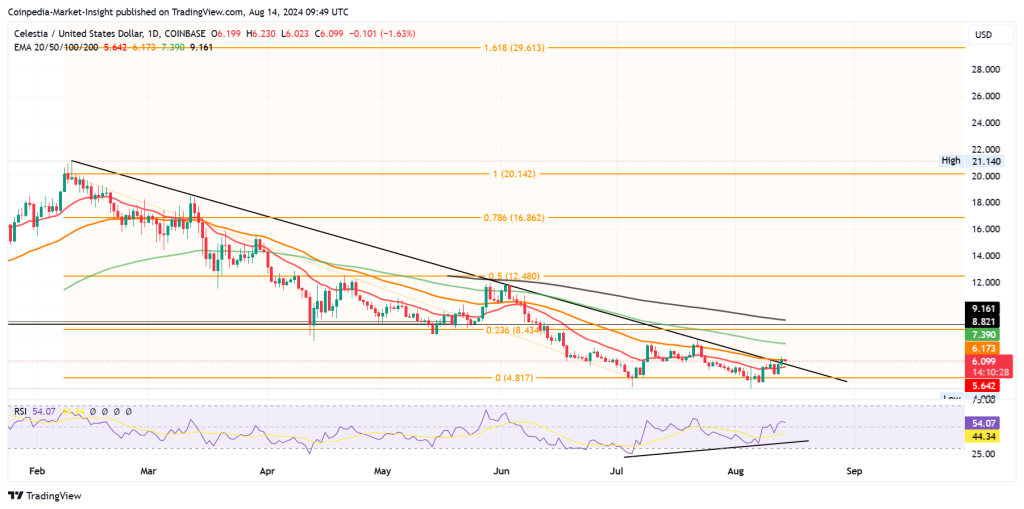
With a price jump of 19% this week, the TIA price has increased by 55% in 8 days. Further, it completes a morning star pattern in the weekly chart. In the daily chart, the sideways trend at $4.817 takes a bullish turn resulting in a trendline breakout.
Fueled by the bullish RSI divergence, the TIA price exceeds the 20D EMA. However, the overhead supply resulted in a reversal from the 50D EMA.
As the altcoin stands at a crossroads, the bull run might face extreme resistance at 100D and 200D EMA at $7.391 and $9.161, respectively.


 English (US) ·