The post XRP False Breakout Triggers $1.4 Million Liquidation, What’s Next? appeared first on Coinpedia Fintech News
On September 21, 2024, XRP, the world’s seventh-biggest cryptocurrency by market cap, experienced notable price fluctuations, resulting in the liquidation of $1.4 million in long and short positions. Over the past few days, XRP had been in a consolidation zone between $0.559 and $0.598.
XRP Experiences False Breakout
Amid this ongoing consolidation, at 22:00 sharp, XRP experienced a price jump of over 4.5%, leading to a breakout from the consolidation and the liquidation of $1.14 million worth of short positions.
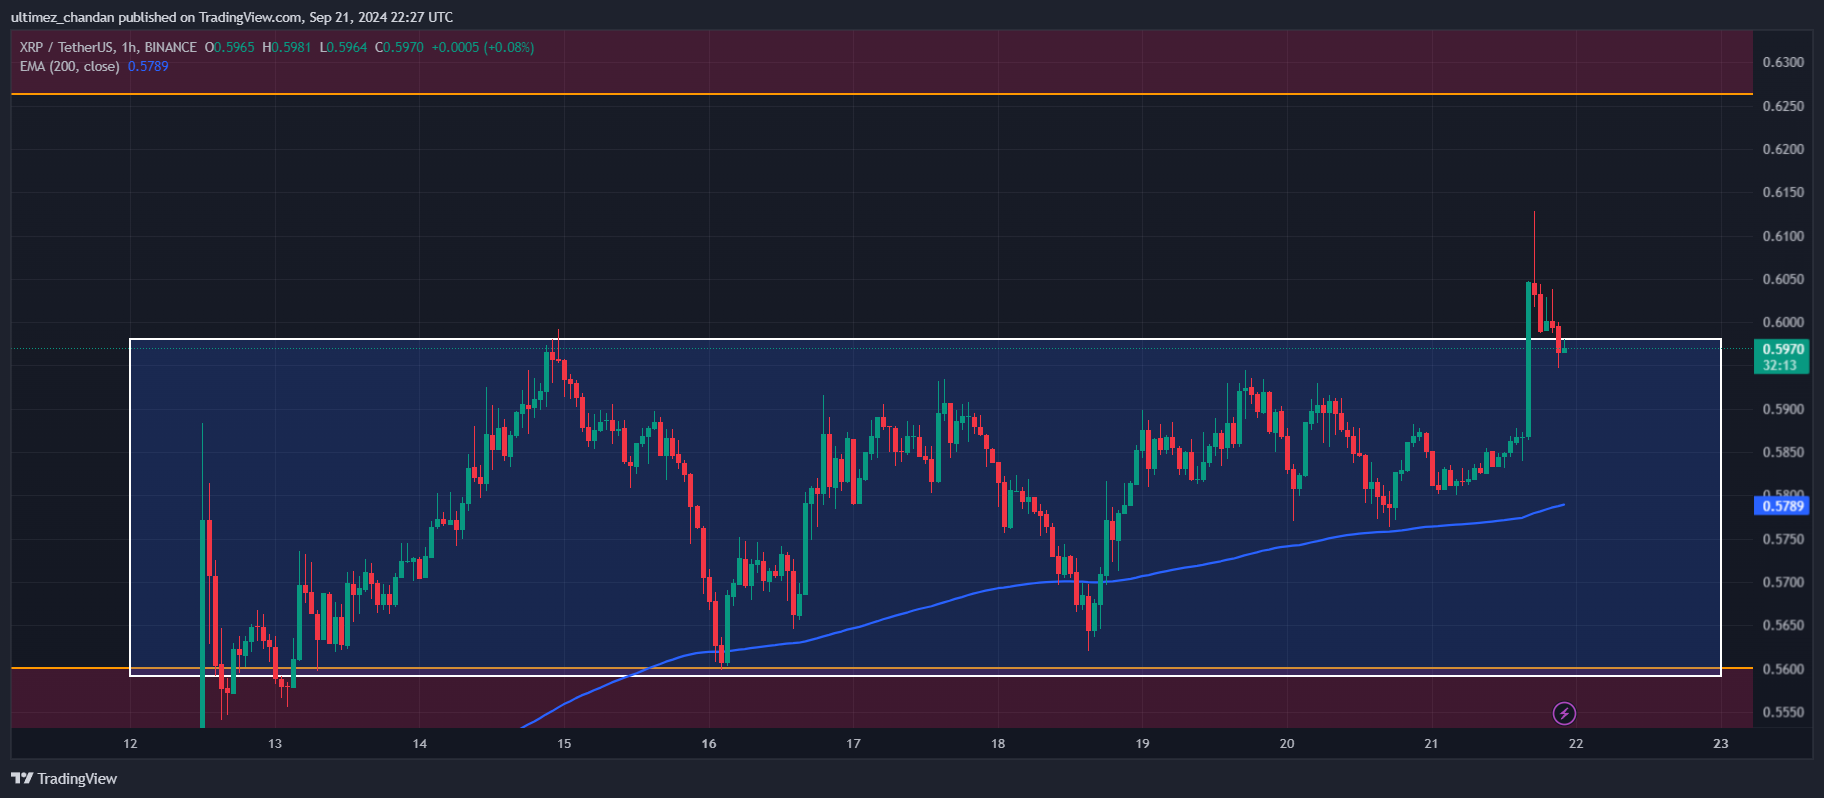 Source: Trading View
However, as XRP closed its one-hour candle above the consolidation zone, traders built large positions on the long side, believing that the XRP rally would continue. Later, however, the XRP price reversed sharply, resulting in the liquidation of $241,700 worth of long positions.
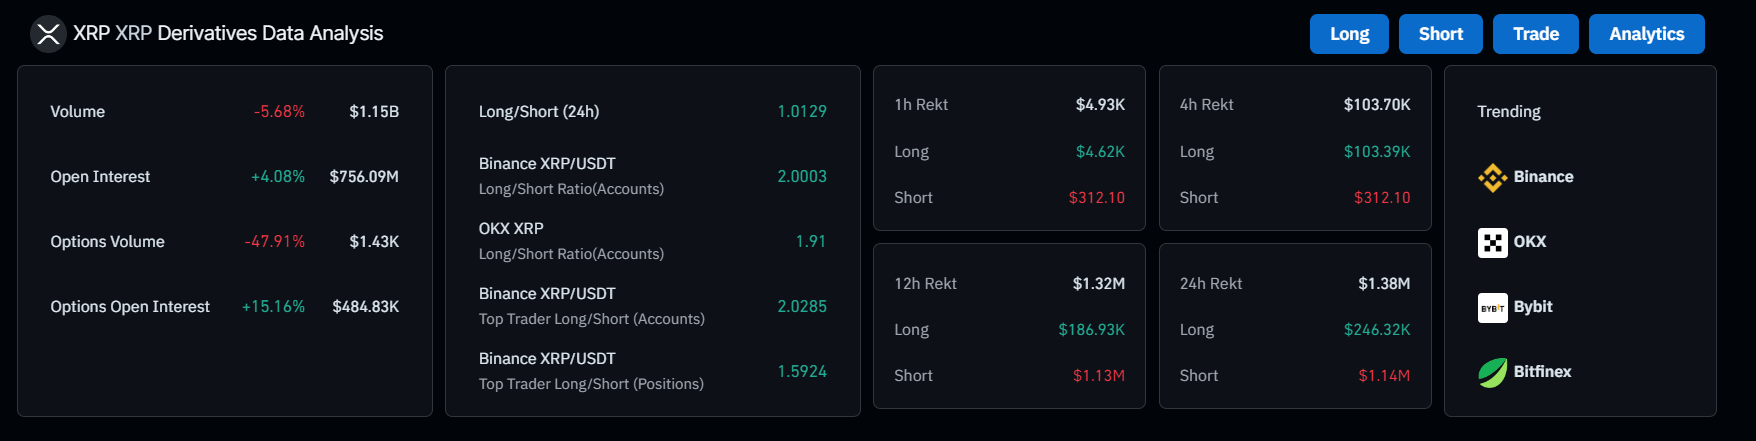 Source: Coinglass
Traders Bearish Sentiment
Coinglass’s XRP long/short ratio currently stands at 0.90, indicating bearish market sentiment among traders. However, 52.5% of top traders hold short positions, while 47.5% hold long positions.
XRP Current Price Momentum
At press time, XRP is trading near $0.597 and has experienced a price surge of over 1.75% in the last 24 hours. During the same period, its trading volume dropped by 24%, indicating lower participation from traders and investors.
XRP Technical Analysis and Upcoming Levels
According to expert technical analysis, XRP is in an uptrend and consolidating in a very tight range. If it breaks out of the consolation zone and closes a daily candle above that zone, there is a strong possibility that the XRP price could soar by 10% to reach the $0.65 level. On the other hand, if XRP fails to close the daily candle above that zone, it will continue to struggle within the zone.
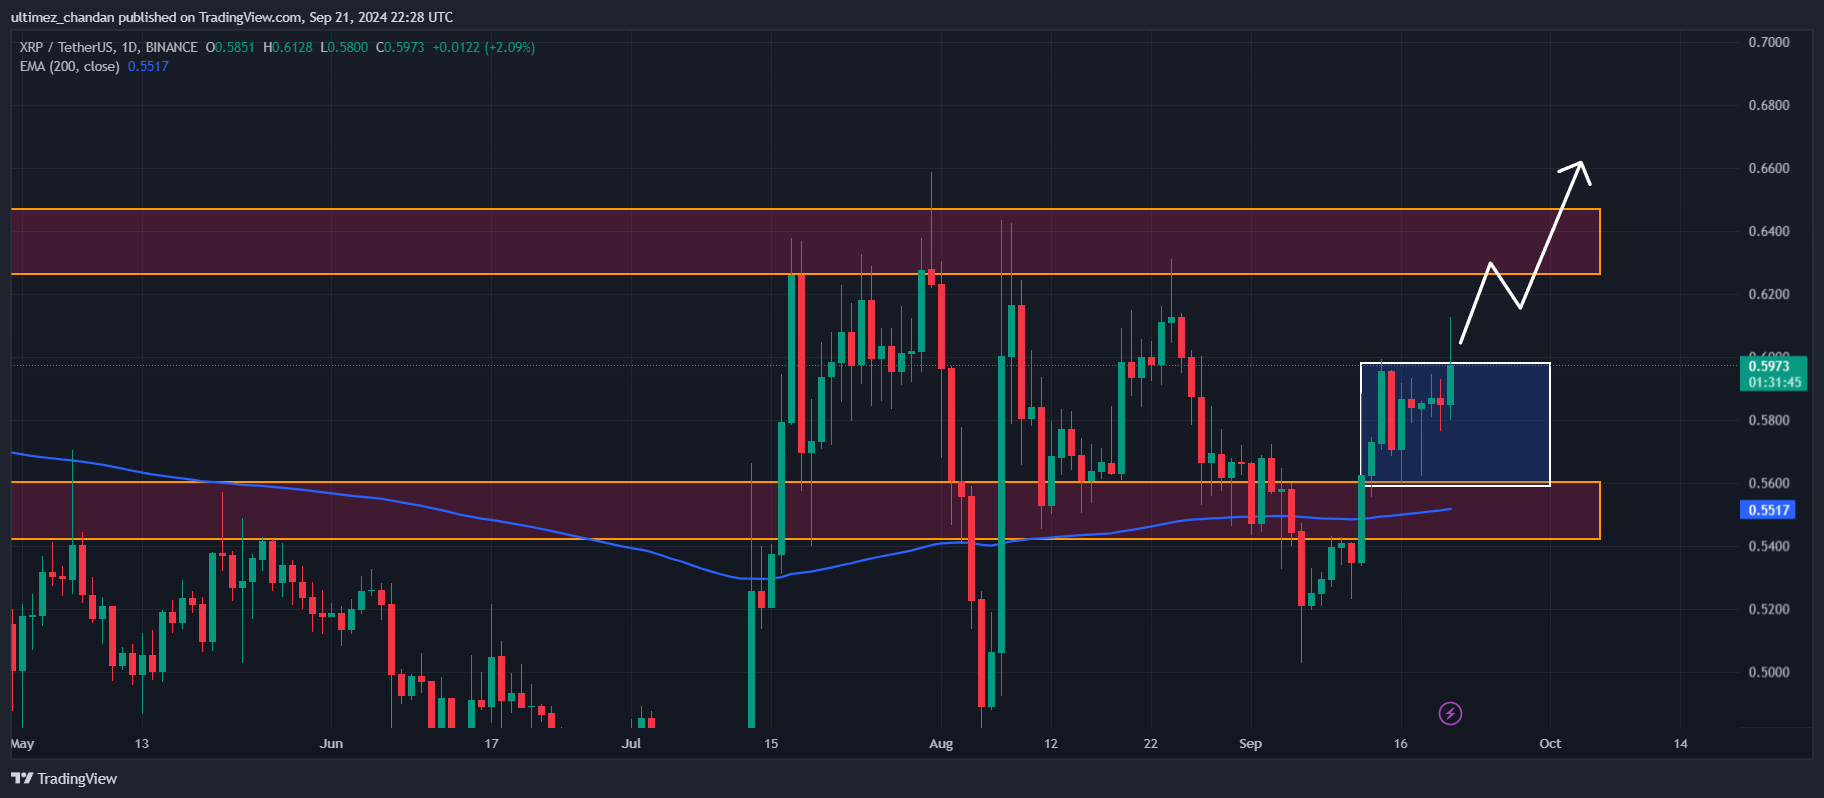 Source: Trading View
At present, XRP is trading above the 200 Exponential Moving Average (EMA) on a daily time frame. If the asset’s price is above 200 EMA, it indicates that the asset is in an uptrend, and vice versa.


 English (US) ·